Calbryte™ series
Calbryte™ series
The Calbryte™ series is a family of fluorescent dyes developed to monitor intracellular calcium. It includes three novel calcium indictors: Calbryte™ 520, Calbryte™ 590 and Calbryte™ 630. These indicators differ primarily in their excitation and emission wavelengths and can be detected using standard fluorescence instruments. The Calbryte™ series has been optimized for use with fluorescence microscopes, fluorescence microplate readers and flow cytometers. They can also be used in high-throughput screening applications.
The Calbryte™ dyes have several key advantages over dyes like Fluo-3 and Fluo-4. Calbryte™ dyes generate much brighter signals, show significantly improved signal-to-background ratio and have greatly enhanced cellular retention. These qualities make the Calbryte™ series a superior choice over older, more traditional calcium indicators.
Can you tell me more about the Calbryte™ dyes?
Dyes in the Calbryte™ series are named roughly according to their maximal emission wavelength. For example, Calbryte™ 520 fluoresces in the green region of the visible spectrum while Calbryte™ 590 and Calbryte™ 630 fluoresce in the red and deep-red region, respectively. All three indicators can be acquired in either AM ester form or salt form (as a potassium salt). The AM ester form is a cell-permeable form that is useful for assaying calcium in live cells. The salt form is primarily used for the calibration of calcium indicators. This step is often required when calculating intracellular calcium concentration from fluorescence signal intensity. Salt forms of Calbryte™ can also be used for microinjection into live cells and tissue.
How do the Calbryte™ dyes work in live cells?

When assaying calcium in live cells, the preferred method is to synthesize Calbryte™ dyes with several acetoxymethyl ester (AM ester) functional groups. The reason for doing so is two-fold.
First, AM esters are lipophilic groups that, when attached to the Calbryte™ core structure, create an overall more hydrophobic compound. This increased hydrophobicity allows the Calbryte™ AM ester to easily penetrate intact lipid membranes and permeate into live cells. This eliminates the need for electroporation, microinjections or other similarly disruptive loading techniques.
Second, Calbryte™ dyes, while in AM ester form, are essentially non-fluorescent and non-activatable. They show minimal response to, for example, trace Ca2+ present in extracellular solution. It is only once the Calbryte™ probe permeates into the cell, and only after intracellular esterases cleave off the AM ester function groups, that the Calbryte™ dye becomes activated and responsive to calcium. This two-step activation process is important because it greatly minimizes non-specific, background fluorescence. And by extension, it significantly enhances intracellular calcium signals.
Once the Calbryte™ probe is activated, it detects calcium through a typical chelation process. Unlike other chelators such as Fluo-3 and Fluo-4, however, Calbryte™ dyes show much greater responses upon binding to calcium. In experiments, Calbryte™ probes have shown a greater than 300-fold increase in fluorescence upon chelation. In comparison, Fluo-4 only demonstrates a 100-fold increase. This drastic improvement in fluorescence response allows for an extremely robust detection of calcium not achievable with past calcium indicators.
What are the advantages of using Calbryte™ dyes?
Calbryte™ dyes easily outperform older, more traditional calcium indicators. In live cell experiments, Calbryte™ dyes yield signal-to-background ratios that are an order of magnitude greater than other dyes such as Fluo-4. This is a huge advantage in experimental studies. As many researchers can attest to, poor signal to background ratios are a headache for data analysis. It conflates results with noise, masks potentially significant data and leads to huge assay-to-assay variability. For this reason, when choosing reagents, most researchers prefer ones that have good to great signal-to-background ratios.
Poor signal-to-background ratios can be caused by a multitude of factors that largely fall into two categories. First, there are factors that lead to poor signal intensity. These can include:
- Low extinction coefficient and/or quantum yield
- Poor binding of the target
- Absorbance maximum (λmax) far from excitation source
Calbryte™ dyes were created to address these concerns. For instance, Calbryte™ 520 has a quantum yield three times greater than that of Fluo-3 or Fluo-4. This means that per photon of light it absorbs, Calbryte™ 520 fundamentally emits more fluorescence than either Fluo-3 or Fluo-4 could, resulting in brighter signal intensity. Additionally, all dyes in the Calbryte™ series are designed such that their maximum absorbance occurs near standard excitation sources. For example, Calbryte™ 520 (with λmax = 492 nm) is well excited by the common 488 nm argon ion laser line.
The second reason many probes exhibit poor signal-to-background ratio is due to high background. High background can be a result of:
- Cell impermeability
- High autofluorescence
- Nonspecific activation/binding
- Poor cellular retention
Many of these factors are related insofar as they concern a probe’s ability to enter a cell and localize efficiently in the cytosol. Looking at many past calcium indicators, they often run into one of two problems. 1) Either the probe would be fairly water soluble, but too hydrophilic to permeate live cells or 2) they would be hydrophobic enough to permeate live cells, but have such poor water solubility that they would precipitate out of solution during loading. Neither case is desirable. With the Calbryte™ series, the challenge has been to create a probe which strikes a delicate balance between water solubility and cell permeability. The Calbryte™ series addresses this problem through manipulation of water-soluble functional groups and the aforementioned AM ester groups. By optimizing the presence and quantity of both groups, Calbryte™ dyes are able to obtain drastically higher signal-to-background ratios.
Another reason calcium indicators perform poorly in live cell experiments is because of poor cellular retention. Here, the problem lies with a family of proteins called p-glycoprotein 1 (P-gp). In many cells (such as the well studied HeLa cell line), P-gp acts as an ATP-dependent efflux pump, actively moving a broad range of small molecules from intracellular to extracellular space. With regards to calcium indicators, this poses a problem because activated calcium indicators can “leak” out of the cell through these pumps and into the extracellular matrix. This type of leakage results in a two-fold problem. First, because the leaked calcium probes have been activated (due to removal of AM esters by intracellular esterases), they will bind to free calcium in the extracellular matrix and fluoresce. This fluorescence is not the signal of interest, however, and thus contributes to what is known is a high background, or noise. Second, the leakage of probes into extracellular space results in a decrease of probes within the cell. This leads to reduced detection of intracellular calcium and lower signal intensity, further exacerbating the problem.
Carbachol dose response was measured in CHO-M1 cells with Calbryte™ 520 AM and Fluo-4 AM. CHO-M1 cells were seeded overnight at 50,000 cells/100 µL/well in a 96-well black wall/clear bottom costar plate. 100 µL of 10 µg/ml Calbryte™ 520 AM in HH Buffer or 10 µg/ml Fluo-4 in HH Buffer was added and incubated for 45 minutes at 37 °C. Dye loading solution was then removed and replaced with 200 µL HH Buffer/well. Carbachol (50 µL/well) was added by FlexStation 3 to achieve the final indicated concentrations.

Carbachol dose response was measured in CHO-M1 cells with Calbryte™ 520 AM and Fluo-4 AM. CHO-M1 cells were seeded overnight at 50,000 cells/100 µL/well in a 96-well black wall/clear bottom costar plate. 100 µL of 10 µg/ml Calbryte™ 520 AM in HH Buffer or 10 µg/ml Fluo-4 in HH Buffer was added and incubated for 45 minutes at 37 °C. Dye loading solution was then removed and replaced with 200 µL HH Buffer/well. Carbachol (50 µL/well) was added by FlexStation 3 to achieve the final indicated concentrations.
One solution, that has been well documented, is to use probenecid in conjunction with calcium indicator use. Probenecid, a channel blocker, has shown moderate success in reducing probe leakage. However, its use is far from an ideal solution. This is because there are many experimental targets that are quite sensitive to probenecid. For example, the TRPV2 receptors of sensory ganglia have been shown to be activated by probenecid. On the other hand, probenecid seems to have an inhibitory effect on TAS2R receptors, or taste receptors. For many other serum-sensitive or drug-sensitive targets, the effects of probenecid could be largely unknown. This means that by using probenecid, a research risks the introduction of a completely unknown factor into an experimental design.
Noting this critical problem with existing calcium indicators, Calbryte™ has been specifically designed for high performance without probenecid. Calbryte™ dyes accomplish this by carefully balancing ionic charges across the compound. This leads to a negatively charged, hydrophilic molecule that, once inside the cell, shows dramatically reduced cell leakage. Under probenecid-free conditions, Calbryte™ dyes outperform Fluo-4 by an order of magnitude in terms of signal-to-background ratio.
One final advantage of Calbryte™ dyes is that they are well suited for high-throughput screening (HTS) and drug-discovery applications. Since Calbryte™ dyes have such excellent signal-to-background ratios, they can be utilized in a no-wash format (see Cat No. 36317). Moreover, because probenecid addition is not required, Calbryte™ dyes can easily be used in automated setups.
What Calbryte™ dyes are currently available?
At present, Calbryte™ dyes are available in three different wavelengths: Calbryte™ 520, Calbryte™ 590 and Calbryte™ 630.
Calbryte™ 520 is our upgrade for traditional green fluorescent indicators such as Fluo-3 and Fluo-4. This dye has an excitation maximum at 492 nm, which closely matches the standard 488 nm argon ion laser line. Also, with an emission maximum at 514 nm, this dye is compatible with the FITC filter sets found in most fluorescence instruments. Because Calbryte™ 520 has spectral values nearly identical to that of Fluo-4, no additional instrument setup is required. This allows for a seamless and convenient transition between products.
Calbryte™ 590 is our upgrade for orange-red fluorescent indicators such as Calcium Orange™ and Rhod-2. This dye has an excitation maximum at 580 nm and is well excited by the 555 nm laser line. It has an emission maximum at 592 nm, making it compatible with TRITC/Cy3 filter sets. Calbryte™ 590 is approximately ten times more sensitive for calcium than Rhod-2, under comparable conditions. Moreover, unlike Rhod-2 which primarily localizes in mitochondria, Calbryte™ 590 retains well in the cytosol of cells.
Calbryte™ 630 is our upgrade for red & deep-red fluorescent indicators such as X-Rhod-1. This dye has an excitation maximum at 608 nm, which aligns well with the 594 nm laser line. This dye has an emission maximum at 624 nm and is compatible with common Texas® Red filter sets. Because of its distance from the green region of the spectrum, Calbryte™ 630 is well suited for multiplex with a green fluorescent label such as iFluor 488, Alexa Fluor 488 or GFP. Moreover, Calbryte™ 630’s long emission wavelength makes it well suited for study of deep tissue. This is because longer wavelength dyes have an easier time penetrating through many cell layers, whereas short-wavelength dyes cannot.

Response of endogenous P2Y receptor to ATP in CHO-K cells. CHO-K cells were seeded overnight at 40,000 cells per 100 µL per well in a 96-well black wall/clear bottom costar plate. 100 µL of Calbryte™ 520 AM (left), Calbryte™ 590 AM (middle) or Calbryte™ 630 AM (right) in HHBS with 2 mM probenecid were added into the wells, and the cells were incubated at 37 °C for one hour. The dye loading mediums were replaced with 200 µL HHBS, treated with 50 µL of 50 µM ATP, and imaged with a fluorescence microscope (Keyence) using FITC channel (Calbryte™ 520), TRITC channel (Calbryte™ 590) or Texas Red channel (Calbryte™ 630).
What other forms do Calbryte™ dyes come in?
Calbryte™ dyes are also available in potassium salt form. These products are designed to help researchers perform calibration of calcium indicators. Calibration of calcium indicators may be required before determining calcium concentration from fluorescence intensity. For a more detailed protocol on how to use Calbryte™ salts, please click here.
What other specifications should I know for the Calbryte™ dyes?
Calbryte™ dyes are shipped lyophilized (desiccated) and can be stored for up to a year if frozen (< -20 °C). During use, Calbryte™ dyes can be reconstituted with a small amount anhydrous DMSO. Reconstituted Calbryte™ dyes can be stored for up to three months if frozen (< -20 °C).
Another specification of interest for some researchers is the dissociation constant (Kd). Please see the table below for Calbryte™ Kd values.
| Ca2+ Indicator | Excitation (nm) | Emission (nm) | Kd (µM) |
| Calbryte™ 520 | 492 nm | 514 nm | 1.2 |
| Calbryte™ 590 | 580 nm | 592 nm | 1.4 |
| Calbryte™ 630 | 608 nm | 624 nm | 1.2 |
Calbryte™ is a new generation of fluorescence based dyes optimized for intracellular calcium flux assays and high throughput screening of G protein-coupled receptors (GPCRs). Calbryte™ is excellent at targeting calcium channels. It is also used for screening calcium channel agonists and antagonists in live cells.
Calbryte™ will be available in the traditional green (Calbryte™ 520), orange (Calbryte™ 590) and red (Calbryte™ 630) fluorescence wavelengths. This mirrors our Cal-520/590/630® series, which will allow for seamless upgrades to Calbryte™.
The key features of our Calbryte ™ series includes:
1. Significantly improved signal-to-noise ratio with a much brighter fluorescence than traditional indicators like Fluo-4.
2. Improved intracellular retention – even without probenecid, Calbryte™ leakage from cells is minimal.
3. Easier and more convenient loading into cells, much faster loading than Cal-520® and equivalents.
Calbryte™ 520/590/630 Calcium Detection Reagents
Introduction
Calbryte™ 520, Calbryte™ 590 and Calbryte™ 630 provide the most robust homogeneous fluorescence-based assay tools for detecting intracellular calcium mobilization. These calcium-sensitive dyes are significantly brighter, and provide much higher signal to noise ratio with greatly improved intracellular retention and loading efficiency compared to the existing calcium indicators (such as Fluo-3 AM, Fluo-4 AM and Rhod-2 AM). Cells expressing a GPCR or calcium channel of interest that signals through calcium can be preloaded with Calbryte™ 520 AM, Calbryte™ 590 AM or Calbryte™ 630 AM which can cross cell membranes. Once inside cells, the lipophilic blocking AM groups of Cal 520® AM, Calbryte™ 590 AM or Calbryte™ 630 AM are cleaved by intracellular esterases, resulting in a negatively charged fluorescent Calbryte™ dyes that stays inside cells. Their fluorescence is greatly enhanced upon binding to calcium. When cells stimulated with agonists, the receptor signals the release of intracellular calcium, which significantly increase the fluorescence of Calbryte™ 520, Calbryte™ 590 or Calbryte™ 630. The characteristics of high sensitivity and >100 times fluorescence enhancement make Calbryte™ 520 AM, Calbryte™ 590 AM or Calbryte™ 630 AM the most robust indicators for measuring intracellular calcium.
Besides their convenient excitation wavelengths and large fluorescence enhancement by calcium, Calbryte™ 520, Calbryte™ 590, and Calbryte™ 630 are predominantly localized in cytosols unlike Rhod-2 that is mainly localized in mitochondria. In addition, the long Ex/Em wavelengths of Calbryte™ 590 and Calbryte™ 630 make these dyes perfect calcium indicators compatible for multicolor detection with green fluorescent protein (GFP) cell lines. In addition, Calbryte™ 520, Calbryte™ 590 or Calbryte™ 630 calcium assays are optimized to be compatible with most of the existing fluorescence instruments. Calbryte™ 520 can be well excited at 488 nm, and used with FITC filter set. Calbryte™ 590 is optimized to be excited at 555 nm, and used with TRITC/Cy3 filter set. Calbryte™ 630 is optimized to be excited at 594 nm, and used with Texas Red® filter set. The spectral and calcium binding properties are summarized below (see Table 1).
Table 1. Spectral and Ca2+–Binding Properties of Calbryte™ 520, Calbryte™ 590 or Calbryte™ 630 Reagents
| Ca2+ Indicator | Excitation (nm) | Emission (nm) | Kd (μM) |
| Calbryte™ 520 | 492 nm | 514 nm | 1.2 |
| Calbryte™ 590 | 581 nm | 593 nm | 1.4 |
| Calbryte™ 630 | 608 nm | 624 nm | 1.2 |
Use of Calbryte™ 520/590/630 AM Esters
e) Incubate the dye-loading plate in a cell incubator for ~60 minutes, and then incubate the plate at room temperature for another 15 minutes.
g) Run the calcium tests at Ex/Em = 490/525 nm for Calbryte™ 520 AM, 540/590 nm for Calbryte™ 590 AM or 610/640 nm for Calbryte™ 630 AM.
|
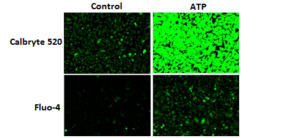
Figure 1. Response of endogenous P2Y receptor to ATP in CHO-K1 cells. CHO-K1 cells were seeded overnight at 40,000 cells per 100 μL per well in a 96-well black wall/clear bottom costar plate. 100 μL of Fluo-4 AM or Calbryte™ 520 AM in HHBS with probenecid were added into the wells, and the cells were incubated at 37 °C for 45min. The dye loading medium were replaced with 200 μL HHBS, 50 μL of 50 μM ATP were added, and imaged with a fluorescence microscope (Keyence) using FITC channel. |
|
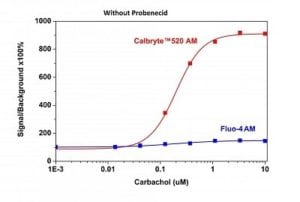
Figure 2. Carbachol-stimulated calcium response of exogenous M1 receptor in CHO-M1 cells measured with Calbryte™ 520 or Fluo-4 AM. CHO-M1cells were seeded overnight in 40,000 cells per 100 μL per well in a 96-well black wall/clear bottom costar plate. 100 μLof Fluo-4 AM or the Calbryte™ 520 AM without probenecid was added into the cells, and the cells were incubated at 37 oC for 45min. Carbachol (50 μL/well) was added by FlexStation 3 (Molecular Devices) to achieve the final indicated concentrations. |
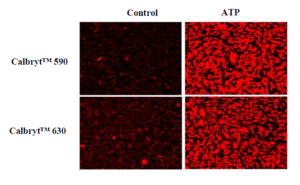 |
Figure 3. Response of endogenous P2Y receptor to ATP in CHO-K cells. CHO-K cells were seeded overnight at 40,000 cells per 100 μL per well in a 96-well black wall/clear bottom costar plate. 100 μL of Calbryte™ 590 AM or Calbryte™ 630 AM in HHBS with 2 mM probenecid were added into the wells, and the cells were incubated at 37 °C for one hour. The dye loading mediums were replaced with 200 μL HHBS, treated with 50 μL of 50 μM ATP, and imaged with a fluorescence microscope (Keyence) using TRITC channel (Calbryte™ 590) and Texas Red Channel (Calbryte™ 630). |
Use of Calbryte™ 520/590/630 Salts
Calcium calibration can be carried out by measuring the fluorescence intensity of the salt form (25 to 50 μM in fluorescence microplate readers) of the indicators in solutions with precisely known free Ca2+ concentrations. Calibration solutions can be used based on 30 mM MOPS EGTA Ca2+ buffer. In general, water contains trace amount of calcium ion. It is highly recommended to use 30 mM MOPS + 100 mM KCl, pH 7.2 as buffer system. One can simply make a 0 and 39 μM calcium stock solutions as listed below, and these 2 solutions are used to make a serial solutions of different Ca2+ concentrations
Where F is the fluorescence intensity of the indicator at a specific experimental calcium level, Fmin is the fluorescence intensity in the absence of calcium and Fmax is the fluorescence intensity of the calcium-saturated probe.
The dissociation constant (Kd) is a measure of the affinity of the probe for calcium. The calcium-binding and spectroscopic properties of fluorescent indicators vary quite significantly in cellular environments compared to calibration solutions. In situ response calibrations of intracellular indicators typically yield Kd values significantly higher than in vitro determinations. In situ calibrations are performed by exposing loaded cells to controlled Ca2+ buffers in the presence of ionophores such as A-23187, 4-bromo A-23187 and ionomycin. Alternatively, cell permeabilization agents such as digitonin or Triton® X-100 can be used to expose the indicator to the controlled Ca2+ levels of the extracellular medium.
Conclusions
As might have been predicted, the interests of many researchers in Ca2+ analysis shifted from the cellular level to the subcellular level. It has been found that Ca2+ is not even distributed throughout the whole cell and that intracellular heterogeneity of Ca2+ (such as Ca2+ waves and Ca2+ sparks) is observed in a variety of cells (e.g., oocyte, heart muscle cell, hepatocyte, and exocrine cell). With the advent of the confocal laser scanning microscope (CLSM) in the 1980s and advanced microplate readers in 2000s (such as FLIPR, FDSS and NOVOStar dedicated for intracellular Ca2+ detections), the measurement of intracellular Ca2+ has accelerated significantly. Confocal laser scanning microscopy and more recently multiphoton microscopy allow the precise spatial and temporal analysis of intracellular Ca2+ signaling at the subcellular level in addition to the measurement of its concentration.
Ordering Information
| Product Code | Product Name | Unit Size |
| 20650-AAT | Calbryte™ 520, AM *Cell-permeable* | 2×50 μg |
| 20651-AAT | Calbryte™ 520, AM *Cell-permeable* | 10×50 μg |
| 20653-AAT | Calbryte™ 520, AM *Cell-permeable* | 1 mg |
| 20656-AAT | Calbryte™ 520, potassium salt | 2×50 μg |
| 20658-AAT | Calbryte™ 520, potassium salt | 10×50 μg |
| 20700-AAT | Calbryte™ 590, AM *Cell-permeable* | 2×50 μg |
| 20701-AAT | Calbryte™ 590, AM *Cell-permeable* | 10×50 μg |
| 20702-AAT | Calbryte™ 590, AM *Cell-permeable* | 1 mg |
| 20706-AAT | Calbryte™ 590, potassium salt | 5×50 μg |
| 20720-AAT | Calbryte™ 630, AM *Cell-permeable* | 2×50 μg |
| 20721-AAT | Calbryte™ 630, AM *Cell-permeable* | 10×50 μg |
| 20722-AAT | Calbryte™ 630, AM *Cell-permeable* | 1 mg |
| 20727-AAT | Calbryte™ 630, potassium salt | 5×50 μg |
| 36317-AAT | Screen Quest™ Calbryte 520™ Probenecid-Free and Wash-Free Calcium Assay Kit | 1 plate |
| 36318-AAT | Screen Quest™ Calbryte 520™ Probenecid-Free and Wash-Free Calcium Assay Kit | 10 plates |
| 36319-AAT | Screen Quest™ Calbryte 520™ Probenecid-Free and Wash-Free Calcium Assay Kit | 100 plates |
| 36200-AAT | Screen Quest™ Calbryte 590™ Probenecid-Free and Wash-Free Calcium Assay Kit | 1 plate |
| 36201-AAT | Screen Quest™ Calbryte 590™ Probenecid-Free and Wash-Free Calcium Assay Kit | 10 plates |
| 36202-AAT | Screen Quest™ Calbryte 590™ Probenecid-Free and Wash-Free Calcium Assay Kit | 100 plates |
Your first choice for scientific solutions
Find out moreSUPPORT
outstanding technical support
PRODUCT
we offer a full product guarantee
DELIVERY
we offer free delivery to UK universities and non profit organisations