Technical Notes

Browse our Available Tech Notes Below

Our technical literature is made available in an effort to improve your experience with our products.

If you can’t find what you are looking for, or if you have any questions, please don’t hesitate to contact our customer service department. Our knowledgable scientist will be happy to help you with any questions you might have in regards to our products.

Gold Nanoparticles

Properties, Characterization & Handling of Gold Nanoparticles

Background

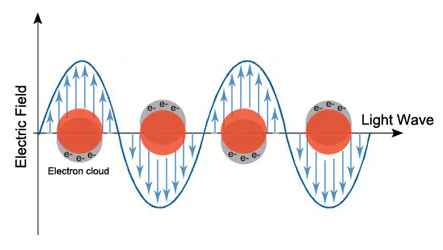
Gold nanoparticles (colloidial gold) have been extensively used for applications both in biology (e.g. bio-imaging) and technology (e.g. photonics) due their unique optical properties. These properties are conferred by the interaction of light with electrons on the gold nanoparticle surface. At a specific wavelength (frequency) of light, collective oscillation of electrons on the gold nanoparticle surface cause a phenomenon called surface plasmon resonance (figure 1) resulting in strong extinction of light (absorption and scattering). The particular wavelength, or frequency, of light where this occurs is strongly dependant on the gold nanoparticle size, shape, surface and agglomeration state as described in more detail below.

Figure 1. Basics of localized surface plasmon resonance (LSPR) of gold nanoparticles due to collective oscillation of surface electrons with incident light at a specific wavelength.

Gold Nanoparticle Size

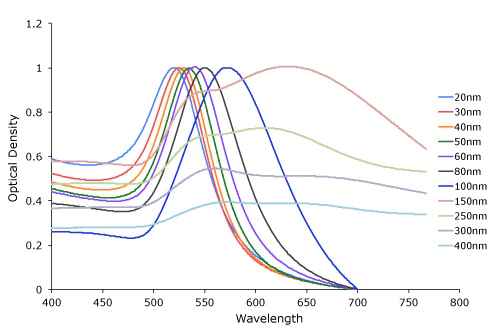
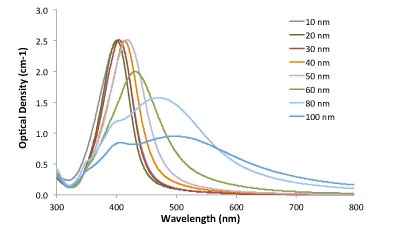
The influence of gold nanoparticle size on the surface plasmon resonance is illustrated in figure 2 below where the absorption maximum (lambda max) increases from 520nm to 570nm for Cytodiagnostics 20nm and 100nm spherical gold nanoparticles, respectively. Particles with sizes above 100nm have broader peaks spanning into the 600nm range due to the presence of both transversal and longitudinal surface plasmon resonances. In comparison, gold nanoparticles with diameters below 2nm do not exhibit surface plasmon resonance.

The difference in extinction between different sized gold nanoparticles can conveniently be utilized for multiplexing.

Figure 2. Gold nanoparticle size dependant surface plasmon resonance. Note the red-shift of the absorption maximum as the gold nanoparticle size increases.

Gold Nanoparticle Shape

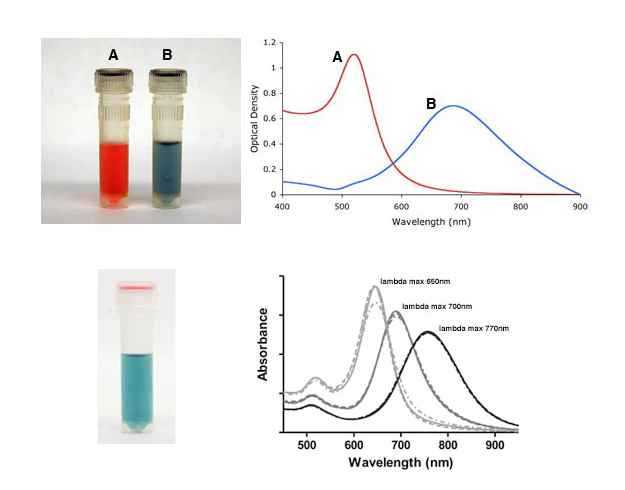
A major determinant of the optical properties of gold nanoparticles is their shape. By synthesizing gold nanoparticles of different shapes, the surface plasmon resonance can easily be tuned to give absorption maxima from around 500nm into the near-infrared part of the spectrum. As an example, Cytodiagnostics spherical collodial gold have absorbance maxima between 515-570nm as described above, while irregular shaped particles such as gold nanorods, and urchin-shaped gold nanoparticles (also called gold nanostars) have absorption maxima in the near-infrared region of the spectra, figure 3. For custom synthesis of gold nanoparticles with irregular shapes please contact us.

The difference in absorption properties between spherical and irregular-shaped gold nanoparticles of the same average size is caused by an anisotropic (uneven) distribution of the surface electron layers.

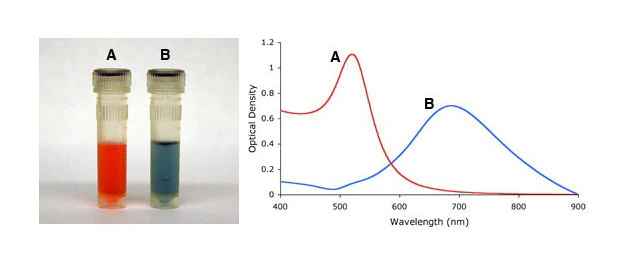
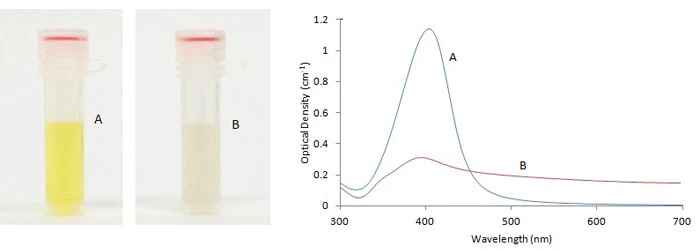
Figure 3. (Top) Gold nanoparticle shape-dependant localized surface plasmon resonance as indicated by the visual appearance and UV-VIS spectra of spherical (A), and urchin-shaped (B) gold nanoparticles (gold nanostars). (Bottom) Absorbance spectra for gold nanorods with three different aspect ratios. Note the presence of two absorption peaks, which are caused by both transversal and longitudinal surface plasmon resonances.


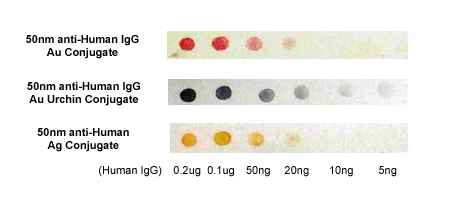
Urchin-shaped (spiky) gold nanoparticles (gold nanostars) are preferable over spherical particles in in vivo based applications due to a reduced background, and higher penetration of near-infrared light through biological tissues. Also, irregular-shaped gold nanoparticles give a higher signal in Surface-Enhanced Raman Spectroscopy (SERS) due to enhancement of the electromagnetic field on the surface caused by the irregular shaped particles. In comparison, spherical particles are ideal for use in application such as immunogold dot-blot protocols (see figure 4 below) and lateral flow rapid tests.

Figure 4. Immuno-dot blot assay illustrating the difference in appearance (color) for three different types of noble metal protein conjugates varying in shape and composition.

Gold Nanoparticle Aggregation

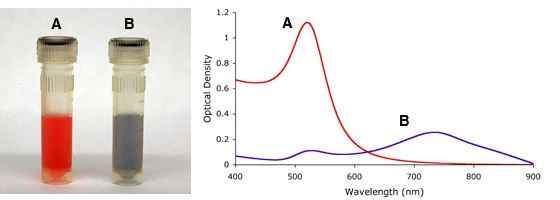
As mentioned above, the aggregation state of gold nanoparticles has an effect on their optical properties. This fact can be used to monitor gold nanoparticle stability, both over time, and upon addition of salt-containing buffers, which at high enough concentrations cause particle aggregation, figure 5. The red-shift in absorption maximum caused by aggregation, or particles in close proximity, has successfully been utilized in many assays as a detection mechanism.

Figure 5. Visual appearance and UV-VIS spectra of monodisperse (A) and sodium chloride (NaCl) induced agglomeration (B) of 15nm gold nanoparticles.

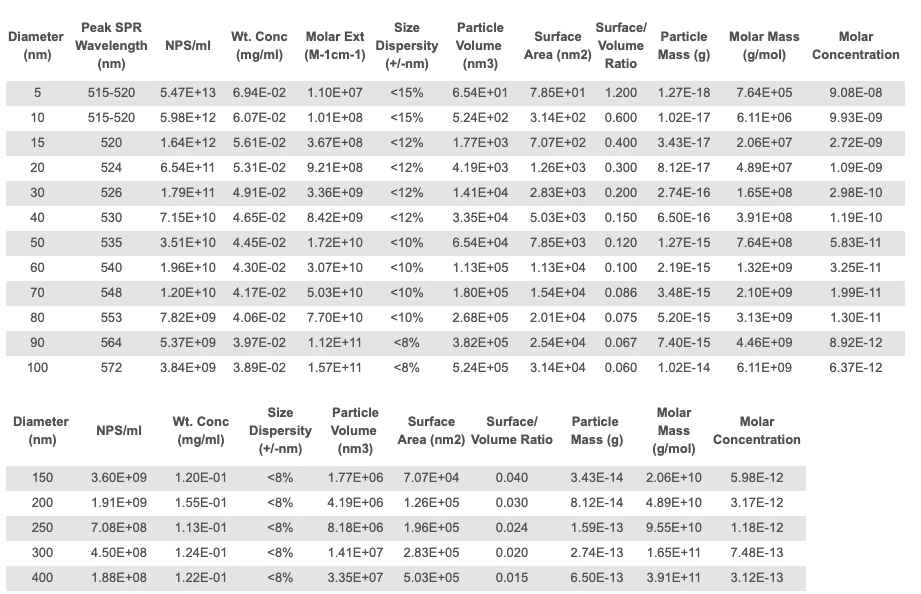
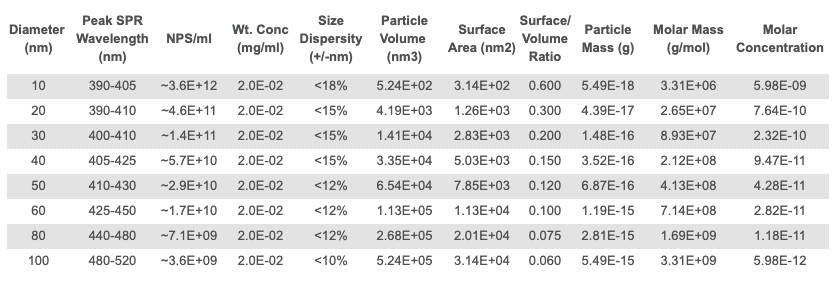
Table I. Summary of the optical and physical properties of Cytodiagnostics gold nanoparticles of various sizes.

Storage

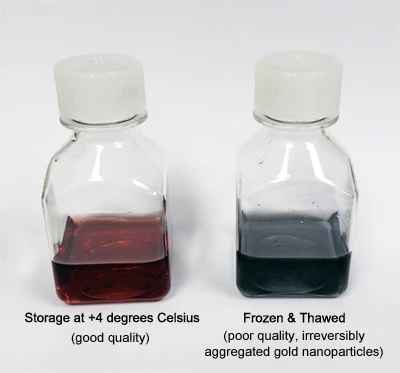
Store product away from direct sunlight at 4-25°C. Lower temperature prolongs the shelf life of the product. Do NOT freeze. If frozen, our non-functionalized spherical gold nanoparticles and non-functionalized gold nanourchins will irreversibly aggregate. This is indicated by a change in colour of the solution as seen for 15nm standard gold nanoparticles in the image below. When stored as specified the colloidal gold is stable for at least 1 year.

Handling

When stored for a long period of time the gold nanoparticles might sediment at the bottom of the flask, which is especially true for larger particle sizes. Prior to use, re-suspend the sedimented particles by swirling until a homogenous solution is obtained.

To maintain optimal performance, and stability of the colloidal gold, care should be taken to use clean storage containers if using other than supplied with the product.

Characterization of Gold Nanoparticles

Please read our “Introduction to Gold Nanoparticle Characterization” tech note for information on how to analyze gold nanoparticles and their properties.

Washing of Gold Nanoparticles

Although it is not always necessary to wash the gold nanoparticles prior to use, some applications might require additional washing procedures. The easiest way to remove possible contaminants in the nanoparticles solution is by centrifugation. Centrifugation force is dependant on size of the gold nanoparticles and should be adjusted according to table I for optimal performance.

Note:
Since non-functionalized gold nanoparticles are sensitive to salt containing buffers, re-suspension should always be performed in ultra-pure water to prevent irreversible aggregation. Irreversible aggregation is characterized by a clear to bluish solution upon the addition of salt.


Procedure

  1. Place aliquot of gold nanoparticle solution in appropriate centrifuge tube.*
  2. Centrifuge the gold nanoparticles for 30 minutes using the appropriate G force depending on size of the gold nanoparticles, see Table I below.
  3. Remove supernatant and re-suspend in appropriate volume of ultra-pure water.
  4. Vortex (sonication in an ultra-sonication bath can also help ) to re-disperse the pelleted gold nanoparticles.

*Note: Addition of Tween 20 to a final concentration of 0.025% (w/v) at this step improves performance during centrifugation and can prevent the formation of aggregates. However, Tween 20 binds to the gold surface and can slightly affect the adsorption of other molecules to the gold surface.

Table I. Appropriate G forces for centrifugation of gold nanoparticles. Note that recommended conditions are for a volume of 1ml and centrifugation using a microcentrifuge, except for 5nm gold nanoparticles that requires an ultracentrifuge.

Gold Nanoparticle Diameter (nm)Centrifugation Speed (x g) Centrifugation Time (minutes)
5nm100,00030
10nm22,000 45
15nm17,00030
20nm10,00030
30nm2,50030
40nm1,40030
50nm1,10030
60nm90030
70nm70030
80nm60030
90nm50030
100nm40030

Background

Gold nanoparticles present distinct optical and physical properties, which are dependent upon their size (diameter), shape, surface structure and agglomeration state. When handling gold nanoparticles, especially when functionalizing their surface with chemical groups or biomolecules, it is often necessary to characterize them, e.g., to evaluate the result of surface modification. This tech note describes some basic techniques for characterizing gold nanoparticles and their modification.

Ultraviolet-Visible (UV-Vis) Spectroscopy

Gold nanoparticles exhibit a distinct optical feature commonly referred to as localized surface plasmon resonance (LSPR), that is, the collective oscillation of electrons in the conduction band of gold nanoparticles in resonance with a specific wavelength of incident light. LSPR of gold nanoparticles results in a strong absorbance band in the visible region (500 nm-600 nm), which can be measured by UV-Vis spectroscopy.

The LSPR spectrum is dependent both on the size (figure 1), and shape (figure 2) of gold nanoparticles. The peak absorbance wavelength increases with particle diameter, and for uneven shaped particles such as gold nanourchins, the absorbance spectrum shifts significantly into the far-red region of the spectrum when compared to a spherical particle of the same diameter.

The peak optical density (OD), or absorbance of the sample, correlates linearly to the concentration of nanoparticles in solution. To correlate the OD value of each size of particles with their concentration (particles/ml), please refer to table 1 below, where an OD value of 1 (with a 1 cm pathlength) applies to nanoparticles between 5 nm and 100 nm.

Figure 1. Gold nanoparticle size dependant surface plasmon resonance. Note the red-shift of the absorption maximum as the gold nanoparticle size increases.

Figure 2. Gold nanoparticle shape dependant localized surface plasmon resonance as indicated by the visual appearance and UV-VIS spectra of spherical (A), and urchin-shaped (B) gold nanoparticles (“spiky gold”).

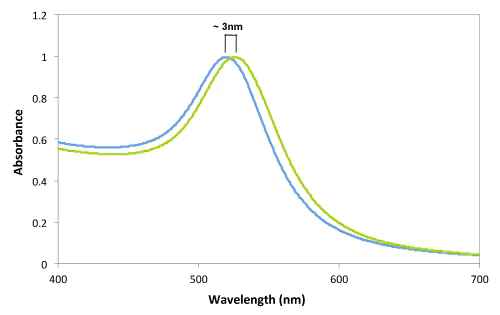
UV-VIS measurements can also be used to evaluate the functionalization of gold nanoparticles. Upon binding of ligands to the gold nanoparticle surface, the LSPR spectrum will red-shift by a few nanometers, as shown in Figure 3. This shift is a result of an increase in the local refractive index at the gold nanoparticle surface, and is the basis of label-free SPR biosensing. For particles with uneven shapes such as gold nanourchins or gold nanorods this local refractive index change is more profound due to a further enhancement of the electromagnetic field at points of “unevenness” at the particle surface.

Figure 3. UV-VIS spectrum of 20nm gold nanoparticles, before (blue) and after (green) conjugation to an antibody. Note the 3nm red-shift of the LSPR peak while maintaing the overall shape and intensity of the spectra indicating successful conjugation of the antibody to the gold surface.

Similarly, aggregation states of gold nanoparticles, i.e., irreversible inter-particle coupling, are also accompanied by a red-shift in the spectrum, as well as broadening of absorption peaks, and a decrease in peak intensities. Aggregation states are also visibly detected by a change in color of the solution from red to blue/purple, as shown in Figure 4. UV-Vis measurements thus provide a simple method to assess the stability of gold nanoparticles, which can be applied to monitor their quality over time as well as evaluating the integrity of the colloidal solution when performing surface modifications. For example, non-functionalized gold nanoparticles aggregate upon the addition of NaCl but when the gold surface is completely shielded by a layer of a conjugated protein, aggregation can be prevented. More details on protein conjugation to gold nanoparticles can be found in Tech Note 102 – Passive Adsorption of Proteins to Gold Nanoparticles or in Tech Note 105 – Covalent Conjugation of Proteins to Carboxyl Gold Nanoparticles.

Figure 4. Visual appearance (left) and UV-Vis spectra (right) of monodisperse (A) and sodium chloride (NaCl) induced heavily agglomerated (B) 15nm gold nanoparticles.

Dynamic Light Scattering (DLS)

Dynamic light scattering (DLS) is an analytical technique used for measuring the size and size distribution of submicron-sized particles. In the measurement, a particle suspension is illuminated by a laser beam, and the fluctuation of scattered light is monitored and analyzed, to acquire the velocity of the particles’ Brownian motion and thereby inferring their size.

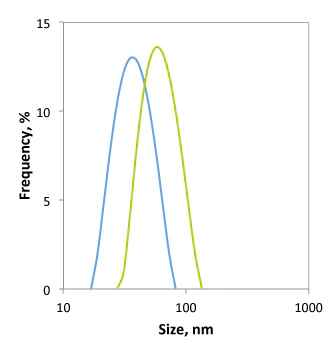
DLS measures the hydrodynamic size of particles, which includes not only the physical size of the nanoparticle core, but also the surface coating and solvent layer associated with the particle. Therefore, the conjugation of molecules such as PEG, proteins, or oligonucleotides to the gold nanoparticle surface increases their hydrodynamic size. This technique therefore provides another tool to evaluate surface modifications. Figure 5 shows the change of 20 nm gold nanoparticles upon binding of a PEG layer.

Aggregation of gold nanoparticles can also be measured with DLS. While non-aggregated monodispersed gold nanoparticles are measured with DLS as a single size population, aggregation of the particles can present a broadening of the peak, increase in hydrodynamic size, and even multiple populations.

DLS measurement of gold nanoparticles is a very sensitive technique and can be applied not only to measure the size of particles, characterizing surface modification, monitoring the stability of gold nanoparticles over a period of time, but also as a detection approach for bio-assays.

Figure 5. Size histogram obtained by dynamic light scattering measurement of 20 nm gold nanoparticles before (blue) and after (green) surface functionalization with a 3kDa PEG-thiol. The hydrodynamic size increased from 30 nm to 48 nm through the addition of a PEG-layer.

Microscopic Imaging of Gold Nanoparticles

While the limit of resolution of optical microscopy is only sub-micron, electron microscopy, such as Transmission Electron Microscopy (TEM) and Scanning Electron Microscopy (SEM), have a resolution down in the sub-nanometer range. TEM is typically used to determine the physical size and structural morphology of gold nanoparticles. TEM is also a commonly used detection method in immunohistochemistry protocols using gold conjugate detection probes. TEM is also a good technique for studying cellular uptake of gold nanoparticles.

Another important microscopic approach for imaging gold nanoparticles is dark field microscopy. Because of the strong surface plasmon resonance light scattering, gold nanoparticles can be visualized as bright points under a dark field microscope. The color displayed is determined by the peak SPR wavelength. As shown in the dark field microscopy images in Figure 6, spherical gold nanoparticles appear green and gold nanourchins appear red, due to their peak SPR and scattering in the 500 nm and 600 nm range, respectively.

Figure 6. Darkfield microscopy images of silver, gold and gold nanourchin nanoparticles. Note how the wavelength of scattered light changes with nanoparticle composition and nanoparticle shape.

Gel Electrophoresis

Gel electrophoresis is a common analytical technique that separates macromolecules or particles based on their size, shape and charge. It is a powerful tool for analyzing gold nanoparticles and their surface modification. The distinct color of gold nanoparticles and other noble metal nanoparticles enables direct observation of the sample and its migrations within the gel.

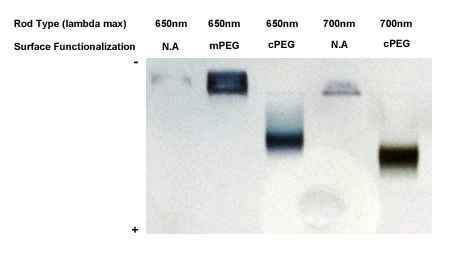
Modification of the gold surface with charged ligands or molecules such as amine-PEG, carboxyl-PEG, oligonucleotides or proteins generally results in a change in the surface charge, which can be seen by an altered migration pattern (direction or migration distance) in agarose gel electrophoresis, see Figure 7. Also, surface coating with biomolecules such as proteins increases the size of the nanoparticles, thereby slowing down their electrophoretic speed when compared to unmodified gold nanoparticles.

Gel electrophoresis can thus be effectively used in optimizing the conjugation conditions of molecules onto gold nanoparticles, by revealing the point of saturation beyond which increased loading of molecules causes no further migration shift of the band. Agarose gel electrophoresis can also be used for separation followed by isolation and purification of individual components after functionalization.

Figure 7. Agarose gel analysis of two types of gold nanorods functionalized with either methoxy-PEG-SH or carboxyl-PEG-SH. Note the change in migration pattern between the mPEG and cPEG functionalized samples due to an increased negative charge on the resulting particles. Also, the 700nm absorbing cPEG functionalized gold nanorods migrate faster in the gel than the 650nm cPEG functionalized rods due to their overall smaller size.

Bio-Functionality Testing of Gold Conjugates

Gold nanoparticles are often conjugated with bio-recognition molecules such as antibodies to serve as probes in various bioassays. It is not only important to ensure proper conjugation and stability using aforementioned methods such as UV-Vis measurement, but it is also essential to confirm the functionality of the conjugate, i.e., specific binding of the target analyte.

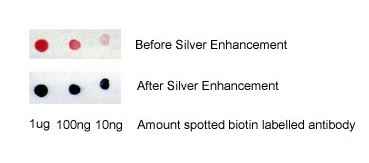
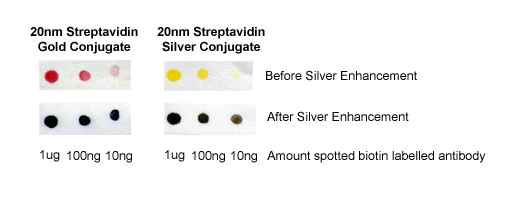
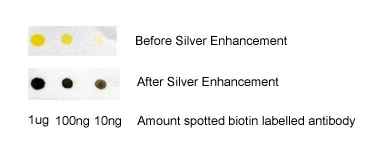
One simple method to evaluate the functionality of a gold conjugate is through immunoblotting. Briefly, a serial dilution of the analyte to be detected is spotted on a nitrocellulose membrane followed by the addition of the conjugate of interest. If the gold conjugate is functional, binding to the spotted analyte will occur, which is conveniently visualized by a bright red color, see Figure 8. Further amplification of the signal can also be accomplished with silver enhancement.

The presence of a conjugated antibody (or antigen) can also be quickly evaluated using our Conjugation QC Lateral Flow Dipstick Kit.

Figure 8. Binding of 20nm streptavidin labeled gold nanoparticles to a biotinylated antibody spotted on a nitrocellulose membrane before and after silver enhancement.

Table I. Summary of optical and physical properties of Cytodiagnostics spherical standard gold nanoparticles.

Product Selection Guides & Product Comparisons

Choose a Gold Nanoparticle Product Based on Your Particular Application

ApplicationGold Nanoparticle Size RangeSurface ChemistryBenefits
Protein Conjugation5nm-100nmStandard (citrate)Quick
NHSCovalent conjugation to primary amines, increased conjugate stability, less non-specific protein binding.
MaleimideCovalent conjugation to thiols, increased conjugate stability, less non-specific protein binding.
CarboxylCovalent conjugation to primary amines, increased conjugate stability, less non-specific protein binding.
AmineConjugation of NHS and carboxyl ligands.
Ni-NTAConjugation to histidine tags. Also useful for purification of histidine-tagged proteins and other ligands.
AzideCovalent conjugation to alkyne ligands through click chemistry.
AlkyneCovalent conjugation to azide ligands through click chemistry.
20nm-100nmDBCOCovalent conjugation to azide ligands through click chemistry without the need for a copper catalyst. More biologically compatible than typical alkyne click chemistry.
StreptavidinConjugation to biotinylated ligands.
Modification with thiolated ligands5nm-100nmStandard (citrate-coated)Classic starting material, no additional stabilizers added.
Stabilized (surfactant)Increased stability during functionalization but reduced binding kinetics.
Oligonucleotide Conjugation5nm-20nmStandard (citrate)Ideal for conjugation of thiol-modified oligos to small particle sizes (5nm-20nm). Does not work well for larger particles.
5nm-100nmOligoREADYIdeal for conjugation of thiol-modified oligos directly to the gold surface.
5nm-100nmNHSIdeal for covalent conjugation of amine-modified oligos. Final conjugate will have a PEG-linker between oligo and gold surface.
5nm-100nmMaleimideIdeal for covalent conjugation of thiol-modified oligos. Final conjugate will have a PEG-linker between oligo and gold surface.
5nm-100nmAzideIdeal for covalent conjugation to alkyne-modified oligos through click chemistry. High yield and no non-specific binding.
5nm-100nmAlkyneIdeal for covalent conjugation to azide-modified oligos through click chemistry. High yield and no non-specific binding.
5nm-100nmDBCOIdeal for covalent conjugation to azide-modified oligos through click chemistry. Much better suited for biological conditions than typical alkyne click chemistry.
Immunoblotting/Western Blot5nm-20nmSecondary Antibody Gold ConjugatesColorimetric detection. Permanent label
Immunohistochemistry5nm-40nmSecondary Antibody Gold ConjugatesHigh contrast label
Flow Cytometry70nm-400nm
Cellular Uptake 30nm-80nmTransferrin Gold ConjugatesActive uptake through endocytosis
Standard (citrate-coated)Non-specific cellular uptake
Darkfield Microscopy50nm-100nmGold Conjugates
Lateral Flow/Dip-Stick Assays20nm-80nmStandard (citrate-coated)Ideal for generation of gold conjugates through passive adsorption of antibodies to the gold nanoparticle surface.
MaleimideIdeal for conjugation of thiol-modified ligands to gold nanoparticles.
Gold ConjugatesPre-made secondary antibody conjugates
Vertical Flow20nm-40nmStandard (citrate-coated)Ideal for generation of gold conjugates through passive adsorption of antibodies to the gold nanoparticle surface.
NHSIdeal for covalent conjugation of antibodies to gold nanoparticles.
MaleimideIdeal for conjugation of thiol-modified ligands to gold nanoparticles.
Gold ConjugatesPre-made secondary antibody conjugates
Tumor Targeting20nm-80nmMethyl (methoxy) Gold NanoparticlesCan in some cases be used for passive targeting of certain tumors in vivo. Inert material with low non-specific protein binding in serum.
Light Microscopy5nm-10nmGold ConjugatesAbility to label tissue sections for both light and electron microscopy. Alternative to peroxidase and PAP-based stains. Sensitivity can be enhanced with silver enhancement techniques.
ELISA5nm-30nmGold ConjugatesColorimetric Detection

Background

Gold nanoparticles present distinct optical and physical properties, which are dependent upon their size (diameter), shape, surface structure and agglomeration state. When handling gold nanoparticles, especially when functionalizing their surface with chemical groups or biomolecules, it is often necessary to characterize them, e.g., to evaluate the result of surface modification. This tech note describes some basic techniques for characterizing gold nanoparticles and their modification.

Ultraviolet-Visible (UV-Vis) Spectroscopy

Gold nanoparticles exhibit a distinct optical feature commonly referred to as localized surface plasmon resonance (LSPR), that is, the collective oscillation of electrons in the conduction band of gold nanoparticles in resonance with a specific wavelength of incident light. LSPR of gold nanoparticles results in a strong absorbance band in the visible region (500 nm-600 nm), which can be measured by UV-Vis spectroscopy.

The LSPR spectrum is dependent both on the size (figure 1), and shape (figure 2) of gold nanoparticles. The peak absorbance wavelength increases with particle diameter, and for uneven shaped particles such as gold nanourchins, the absorbance spectrum shifts significantly into the far-red region of the spectrum when compared to a spherical particle of the same diameter.

The peak optical density (OD), or absorbance of the sample, correlates linearly to the concentration of nanoparticles in solution. To correlate the OD value of each size of particles with their concentration (particles/ml), please refer to table 1 below, where an OD value of 1 (with a 1 cm pathlength) applies to nanoparticles between 5 nm and 100 nm.

Figure 1. Gold nanoparticle size dependant surface plasmon resonance. Note the red-shift of the absorption maximum as the gold nanoparticle size increases.

Figure 2. Gold nanoparticle shape dependant localized surface plasmon resonance as indicated by the visual appearance and UV-VIS spectra of spherical (A), and urchin-shaped (B) gold nanoparticles (“spiky gold”).

UV-VIS measurements can also be used to evaluate the functionalization of gold nanoparticles. Upon binding of ligands to the gold nanoparticle surface, the LSPR spectrum will red-shift by a few nanometers, as shown in Figure 3. This shift is a result of an increase in the local refractive index at the gold nanoparticle surface, and is the basis of label-free SPR biosensing. For particles with uneven shapes such as gold nanourchins or gold nanorods this local refractive index change is more profound due to a further enhancement of the electromagnetic field at points of “unevenness” at the particle surface.

Figure 3. UV-VIS spectrum of 20nm gold nanoparticles, before (blue) and after (green) conjugation to an antibody. Note the 3nm red-shift of the LSPR peak while maintaing the overall shape and intensity of the spectra indicating successful conjugation of the antibody to the gold surface.

Similarly, aggregation states of gold nanoparticles, i.e., irreversible inter-particle coupling, are also accompanied by a red-shift in the spectrum, as well as broadening of absorption peaks, and a decrease in peak intensities. Aggregation states are also visibly detected by a change in color of the solution from red to blue/purple, as shown in Figure 4. UV-Vis measurements thus provide a simple method to assess the stability of gold nanoparticles, which can be applied to monitor their quality over time as well as evaluating the integrity of the colloidal solution when performing surface modifications. For example, non-functionalized gold nanoparticles aggregate upon the addition of NaCl but when the gold surface is completely shielded by a layer of a conjugated protein, aggregation can be prevented. More details on protein conjugation to gold nanoparticles can be found in Tech Note 102 – Passive Adsorption of Proteins to Gold Nanoparticles or in Tech Note 105 – Covalent Conjugation of Proteins to Carboxyl Gold Nanoparticles.

Figure 4. Visual appearance (left) and UV-Vis spectra (right) of monodisperse (A) and sodium chloride (NaCl) induced heavily agglomerated (B) 15nm gold nanoparticles.

Dynamic Light Scattering (DLS)

Dynamic light scattering (DLS) is an analytical technique used for measuring the size and size distribution of submicron-sized particles. In the measurement, a particle suspension is illuminated by a laser beam, and the fluctuation of scattered light is monitored and analyzed, to acquire the velocity of the particles’ Brownian motion and thereby inferring their size.

DLS measures the hydrodynamic size of particles, which includes not only the physical size of the nanoparticle core, but also the surface coating and solvent layer associated with the particle. Therefore, the conjugation of molecules such as PEG, proteins, or oligonucleotides to the gold nanoparticle surface increases their hydrodynamic size. This technique therefore provides another tool to evaluate surface modifications. Figure 5 shows the change of 20 nm gold nanoparticles upon binding of a PEG layer.

Aggregation of gold nanoparticles can also be measured with DLS. While non-aggregated monodispersed gold nanoparticles are measured with DLS as a single size population, aggregation of the particles can present a broadening of the peak, increase in hydrodynamic size, and even multiple populations.

DLS measurement of gold nanoparticles is a very sensitive technique and can be applied not only to measure the size of particles, characterizing surface modification, monitoring the stability of gold nanoparticles over a period of time, but also as a detection approach for bio-assays.

Figure 5. Size histogram obtained by dynamic light scattering measurement of 20 nm gold nanoparticles before (blue) and after (green) surface functionalization with a 3kDa PEG-thiol. The hydrodynamic size increased from 30 nm to 48 nm through the addition of a PEG-layer.

Microscopic Imaging of Gold Nanoparticles

While the limit of resolution of optical microscopy is only sub-micron, electron microscopy, such as Transmission Electron Microscopy (TEM) and Scanning Electron Microscopy (SEM), have a resolution down in the sub-nanometer range. TEM is typically used to determine the physical size and structural morphology of gold nanoparticles. TEM is also a commonly used detection method in immunohistochemistry protocols using gold conjugate detection probes. TEM is also a good technique for studying cellular uptake of gold nanoparticles.

Another important microscopic approach for imaging gold nanoparticles is dark field microscopy. Because of the strong surface plasmon resonance light scattering, gold nanoparticles can be visualized as bright points under a dark field microscope. The color displayed is determined by the peak SPR wavelength. As shown in the dark field microscopy images in Figure 6, spherical gold nanoparticles appear green and gold nanourchins appear red, due to their peak SPR and scattering in the 500 nm and 600 nm range, respectively.

Figure 6. Darkfield microscopy images of silver, gold and gold nanourchin nanoparticles. Note how the wavelength of scattered light changes with nanoparticle composition and nanoparticle shape.

Gel Electrophoresis

Gel electrophoresis is a common analytical technique that separates macromolecules or particles based on their size, shape and charge. It is a powerful tool for analyzing gold nanoparticles and their surface modification. The distinct color of gold nanoparticles and other noble metal nanoparticles enables direct observation of the sample and its migrations within the gel.

Modification of the gold surface with charged ligands or molecules such as amine-PEG, carboxyl-PEG, oligonucleotides or proteins generally results in a change in the surface charge, which can be seen by an altered migration pattern (direction or migration distance) in agarose gel electrophoresis, see Figure 7. Also, surface coating with biomolecules such as proteins increases the size of the nanoparticles, thereby slowing down their electrophoretic speed when compared to unmodified gold nanoparticles.

Gel electrophoresis can thus be effectively used in optimizing the conjugation conditions of molecules onto gold nanoparticles, by revealing the point of saturation beyond which increased loading of molecules causes no further migration shift of the band. Agarose gel electrophoresis can also be used for separation followed by isolation and purification of individual components after functionalization.

Figure 7. Agarose gel analysis of two types of gold nanorods functionalized with either methoxy-PEG-SH or carboxyl-PEG-SH. Note the change in migration pattern between the mPEG and cPEG functionalized samples due to an increased negative charge on the resulting particles. Also, the 700nm absorbing cPEG functionalized gold nanorods migrate faster in the gel than the 650nm cPEG functionalized rods due to their overall smaller size.


Bio-Functionality Testing of Gold Conjugates

Gold nanoparticles are often conjugated with bio-recognition molecules such as antibodies to serve as probes in various bioassays. It is not only important to ensure proper conjugation and stability using aforementioned methods such as UV-Vis measurement, but it is also essential to confirm the functionality of the conjugate, i.e., specific binding of the target analyte.

One simple method to evaluate the functionality of a gold conjugate is through immunoblotting. Briefly, a serial dilution of the analyte to be detected is spotted on a nitrocellulose membrane followed by the addition of the conjugate of interest. If the gold conjugate is functional, binding to the spotted analyte will occur, which is conveniently visualized by a bright red color, see Figure 8. Further amplification of the signal can also be accomplished with silver enhancement.

The presence of a conjugated antibody (or antigen) can also be quickly evaluated using our Conjugation QC Lateral Flow Dipstick Kit.

Figure 8. Binding of 20nm streptavidin labeled gold nanoparticles to a biotinylated antibody spotted on a nitrocellulose membrane before and after silver enhancement.

Table I. Summary of optical and physical properties of Cytodiagnostics spherical standard gold nanoparticles.

Conjugation and Modification of Gold Nanoparticles

Background

Gold nanoparticle conjugates have been widely used in biological research and biosensing applications. For example, gold nanoparticles can function as probes in light or electron microscopy, lateral flow immunoassays and immunoblotting protocols such as dot-blots and Western blots.

There are two ways of preparing gold conjugates, i.e. passive adsorption and covalent coupling via a linker. Although a relatively simple preparation process, passive adsorption of proteins to gold nanoparticles does not provide a permanent attachment of the coating because molecules may desorb from the surface over time. In addition, in some cases, the proteins lose their properties after being adsorbed to the surface, which can be caused by changes in tertiary structure or binding of the active site/antigen binding site to the gold surface rendering it inaccessible.

Despite these drawbacks passive adsorption of proteins to gold nanoparticles remains popular and is a simple way of generating a protein gold conjugate. Preparation of gold nanoparticle protein conjugates through passive adsorption to standard spherical gold nanoparticles can be optimized with our convenient Gold Conjugation Optimization Kits for Passive Adsorption.

In comparison to passive adsorption, covalent coupling permanently immobilizes molecules of interest to functionalized gold nanoparticles (e.g. with NHS, carboxyl or amine groups). This approach provides much improved stability of the protein coating over the passive adsorption method. Covalent coupling uses chemical linkers that react with specific chemical groups on the molecule to be conjugated. Therefore, the method is more specific and controllable than the passive adsorption method and the number of covalently conjugated ligands can be optimized for a particular application. Covalent coupling through a linker also have the advantage of minimizing steric hindrance and impact on the tertiary structure of the conjugated protein. All in all this results in less deleterious effects on the properties of a conjugated protein.

Our Carboxyl Gold Nanoparticles, Carboxyl Gold NanoUrchins and Carboxyl Gold Nanorods all rely on EDC/NHS chemistry for conjugation. EDC and NHS “activate” the carboxyl groups on the particle surface to form an intermediate that can subsequently react with primary amine groups on the specific protein or other ligand to be conjugated. The efficiency of EDC conjugation is typically low and sensitive to pH and covalent coupling protocols requires some degree of optimization to achieve desired performance or stability.

The following protocol provides general guidelines for coupling biomolecules to our carboxylated gold ganoparticles, with conjugation of a standard IgG to our 20nm Carboxyl Gold Nanoparticles given as an example. For conjugation of other biomolecules or nanoparticle types, the optimal conjugation conditions may vary. To obtain maximum conjugation to the particle surface, the amount of protein for conjugation is about 1 to 10X excess that of its theoretical quantity needed for full coverage.

Materials and Equipment Required

  • 20nm Carboxyl Gold Nanoparticles
  • Methyl Gold Nanoparticles (negative control)
  • 1-Ethyl-3-[3-dimethylaminopropyl]carbodiimide hydrochloride (EDC) (Sigma, Cat# E1769)
  • N-hydroxysulfosuccinimide (Sulfo-NHS) (Sigma, Cat# 56485)
  • Positive control protein: Horse Radish Peroxidase (HRP) or IgG from human serum (Sigma, Cat# I4506)
  • Blocker: Bovine Serum Albumin (BSA) (Sigma, Cat# A3059)
  • Activation buffer: 2-(N-morpholino)ethanesulfonic acid (MES) buffer (10 mM, pH 5.5)
  • Coupling buffer: 1X Phosphate Buffered Saline (PBS)
  • Washing buffer: 1X Phosphate Buffered Saline + 0.05% Tween 20 (PBST)
  • UV-VIS Spectrophotometer
  • Protein of interest to be conjugated

Note: It is imperative that the protein to be conjugated is pure and free of contaminating proteins (e.g. BSA) and other amine containing components. Any other molecules containing primary amines may compete with the protein to be conjugated and may result in a significant decrease in conjugation efficiency. The protein should also have enough accessible primary amine groups for conjugation. Lysine residues are the primary target sites for EDC conjugation.

Procedure

  1. If the concentration of gold nanoparticles is less than OD 50, concentrate them by centrifugation. If particles are in buffers, wash them in pure water by centrifugation. Refer to “Gold Nanoparticles Handling and Storage” for instructions.
  2. Prepare fresh EDC/NHS mix solution in MES buffer at a concentration of 30 and 36 mg/mL, respectively. Note that EDC/NHS rapidly hydrolyzes in aqueous solutions and should be prepared fresh just prior to conjugation.
  3. Take 10 µL of 20 nm gold nanoparticles (OD 50 in water) and mix with 10 µL of EDC/NHS mix solution as prepared in step 2.
  4. Incubate for 30 min at room temperature
  5. Add 1 mL of PBST and vortex thoroughly
  6. Spin down by centrifugation at 6,500 g for 30 min
  7. Remove most of the supernatant
  8. Add 10 µL of antibody (1 mg/mL in 1X PBS)*
  9. Sonicate in a water bath sonicator for 10 sec
  10. Incubate for 2 to 4 hours at room temperature with mixing
  11. Add 1 mL of PBST and vortex thoroughly
  12. Spin down by centrifugation at 6,500 g for 30 min
  13. Remove most of the supernatant
  14. Add 50 µL PBS with 1% BSA
  15. Store at 4 degrees and ready to use

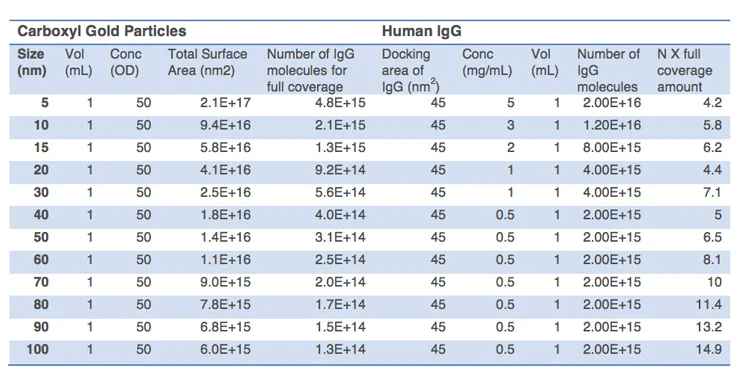
* The concentration of protein may vary depending on the particle size and protein to be conjugated. In general, the amount of protein should be 1 to 10X excess of the amount of full surface coverage. The total surface area of particles and the docking area should be estimated to calculate the optimal amount of protein. The following table is a general reference for conjugating IgG to our Carboxyl Gold Particles of different sizes. The calculation for other proteins are similar but the docking area needs to be calculated for your protein of interest.

Table I. Suggested quantities of IgG for Carboxyl Gold Nanoparticles of different sizes during EDC conjugation. The docking area of an IgG molecule is estimated to be 45 nm2. “N X full coverage amount” means the excess ratio between the incubation amount and the amount needed for full coverage of particle surface.

Frequently Asked Questions

How do I ensure my gold nanoparticle conjugation reaction was successful?

The resulting conjugate can be tested for the presence of the conjugated antibody (or antigen) using immunoblotting (dot-blot) or alternatively using our ready-to-use Conjugation QC Lateral Flow Dipstick Kit.

What is the optimal conjugation pH for conjugation?

Activation of the carboxylated gold nanoparticles using EDC/NHS is generally performed in slightly acidic conditions while the conjugation reaction is optimally performed around pH 7-8.

What is the optional conjugation time?

In our standard protocol, we conjugate 2 to 4 hours at room temperature for proteins. Based on the stability of proteins, a shorter or longer conjugation time should be tested. The conjugation efficiency of EDC is usually low, so a 2 hour incubation are often seen in many protocols. A shorter than 2-hour conjugation period may be enough, depending on the applications and protein concentrations.

It is necessary to carry out a kinetic study on conjugation time versus final result output for different proteins or molecules to be conjugated. For example, we conjugated human IgG to our Carboxyl Gold Nanoparticles for 1 hour, 2 hours, 3 hours and overnight. 2 hours of conjugation time demonstrate the best dot-blot assay performance:

Effect of conjugation time on conjugation efficiency - Dot-Blot analysis

Figure 1. Effect of conjugation time on the performance of dot-blot assay. Particles are incubated with human IgG for 1 hour, 2 hours, 3 hours and overnight. 2 hours of incubation shows the best dot-bot signal among all conjugation times.

What are the pros and cons of 1-step conjugation?

The advantage of 1-step conjugation is its simple procedure. However, 1-step conjugation comes with a risk of crosslinking proteins among themselves, instead of conjugating them onto the particles. This risk is dependent on the structure of the protein to be conjugated, which determines the ratio of the accessible carboxyl groups between the proteins and particles. Also, excess amounts of EDC/NHS will increase the chance of protein crosslinking. It is recommended to carry out titration experiments of protein and EDC/NHS concentrations to find the conditions of maximal conjugation/performance with minimal protein crosslinking.

What other factors can influence conjugation results?

if the conjugation pH and conjugation time are suitable, but there is no positive result, it is necessary to make sure EDC/NHS is freshly prepared just before conjugation. EDC should always be stored at -20 degrees. Effective removal of excess EDC/NHS after activation is important to prevent them from crosslinking proteins.

Introduction

Compared to carboxylated nanoparticles that require activation with EDC/NHS prior to conjugation, Cytodiagnostics NHS-activated gold nanoparticles, silver nanoparticles, and gold nanourchins are all available and shipped pre-activated in a conjugation-ready format. No manipulation of the nanoparticles is required prior to conjugation, which significantly streamlines the workflow, and more importantly, improves overall conjugate quality. As with carboxylated nanoparticles these pre-activated nanoparticles are suitable for conjugation of proteins and other amine containing ligands.

A recommended starting protocol for conjugation can be found below. Note that the amount of protein added may need to be optimized for your particular protein.

Materials

  • NHS-Activated Gold Nanoparticles or NHS-Activated Gold NanoUrchins
  • Protein Resuspension Buffer (supplied with particles above)
  • Reaction Buffer (supplied with particles above)
  • Quenching Solution (supplied with particles above)
  • 10% (w/v) Bovine Serum Albumin (BSA)
  • Conjugate storage buffer: 20mM Tris (pH 8.0), 150mM NaCl supplemented with 1% (w/v) BSA (or other suitable buffer for your protein)

Procedure

  1. Allow all reagents to warm to room temperature before use.
  2. Dilute (or dissolve) your protein/antibody to a final concentration of 0.5 mg/ml using the supplied protein re-suspension buffer.
  3. In a microcentrifuge tube combine your diluted protein with reaction buffer according to table I below.
  4. Transfer 90 µl of your protein/reaction buffer mix prepared in step 2 to one of the vials containing lyophilized NHS-activated gold nanoparticles and immediately mix well by pipetting up and down*.
  5. Incubate the vial at room temperature for 2 hours.
  6. Add 10 µl of quencher solution to the vial to stop the reaction.
  7. Add 10 ul of 10% BSA to the vial.
  8. Using a microcentrifuge, centrifuge the vial for 30 minutes using the appropriate speed for the gold nanoparticle size you are using according to table II below.
  9. Remove supernatant containing unbound protein.
  10. Add 100 ul of conjugate storage buffer to the vial to re-suspend your conjugate.
  11. Repeat step 8-10
  12. Record the UV-VIS spectra of the conjugate using a spectrophotometer, and dilute to desired optical density using conjugate storage buffer.
  13. Store your protein conjugate at 4°C until use.
  14. (Optional Step) Test for successful conjugation using our Conjugation QC Lateral Flow Dipstick Kit.

* Note: Do not re-suspend lyophilized NHS-activated nanoparticles in buffer prior to addition of protein. NHS rapidly hydrolyzes in aqueous solution and may result in loss of conjugation efficiency.

Table I. Quantities of each reagent to mix and add to a single vial of lyophilized NHS-activated nanoparticles.

3 or 10 Reaction KitsMIDI Kits
Reaction Buffer84 ul840 ul
Diluted Protein Solution24 ul240 ul
Total Reaction Volume108 ul1080 ul

Table II. Recommended centrifugation speeds for protein conjugated gold nanoparticles. A centrifugation time of 30 minutes is generally sufficient for a 1 ml sample in a 1.5 ml microcentrifuge tube.

Gold Nanoparticle DiameterCentrifugation Force
5nmUse 100kDa MWCO Spin Columns
10nm22,000 x g *
15nm17,000 x g
20nm10,000 x g
30nm2,500 x g
40nm1,400 x g
50nm1,100 x g
60nm900 x g
70nm700 x g
80nm600 x g
90nm500 x g
100nm400 x g

*For 10nm gold nanoparticles the recovery is estimated to be approximately 50% at this particular speed. For better recovery, 1) use an ultracentrifuge to achieve higher speeds or 2) use 100kDa MWCO Spin Columns (if molecular weight of the conjugated protein is <100kDa).

Description

Oligonucleotide functionalized gold nanoparticles are used in a wide range of applications, with the most common being as probes in bio assays for recognition and detection of other molecules. For example, aptamers can be used to functionalize gold nanoparticle and a depending on the aptamer used, a probe can be generated to bind any molecule of choice.

Oligonucleotides are generally conjugated to gold nanoparticles by utilizing a thiol linker chemically introduced to either the 5′- or 3′-end. Thiols have very strong affinity for gold surfaces and a thiol-modified oligonucleotide (or aptamer) can be conjugated by directly mixing the modified oligo with gold nanoparticles followed by a “salt-aging” procedure that facilitates the binding of the oligo to the gold surface. This method results in a stable gold nanoparticle oligonucleotide conjugate that retains the ability to bind complementary targets. However, this classic method is time consuming due to the required “salt-aging” step and can take up to two days to complete. Further, the gold nanoparticle size is restricted to smaller gold nanoparticles and cannot successfully generate oligonucleotide gold nanoparticles with diameters of 30nm and above.

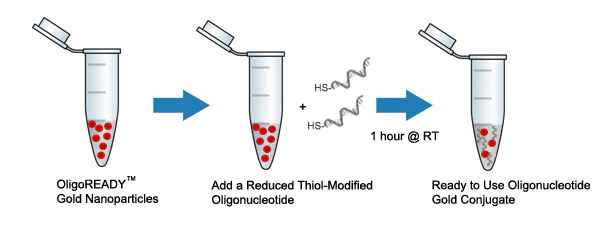
In comparison, Cytodiagnostics OligoREADY gold conjugation kits have been optimized for high efficiency one-step conjugation of thiolated oligonucleotides eliminating the time consuming “salt-aging” steps and size restrictions. Simply mix your reduced thiol-modified oligonucleotide with the pre-activated gold nanoparticles supplied in our kits and your conjugate is ready to be used within 2 hours. As in the classic method above, conjugation of the oligonucleotide is achieved by the formation of a strong and stable gold-thiol bond without any additional linkers. A standard protocol for conjugation of a thiol-modified oligonucleotide to our gold nanoparticles is described below.

Figure 1. Conjugation of a reduced thiolated oligonucleotide to Cytodiagnostics unique OligoREADY gold nanoparticles.


Features & Benefits

  • No size restrictions. Allows conjugation of oligonucleotides to gold nanoparticles with sizes between 5nm-100nm.
  • Fast and convenient one-step conjugation reaction with no pre-activation requirements or manipulation of the gold nanoparticles.
  • Does not require time-consuming “salt-aging” procedures. Reaction can be completed in 2 hours or less.
  • Results in the thiol-oligonucleotide conjugated directly to the gold surface without any linkers.

Materials Required

  • OligoREADY Gold Nanoparticles
  • Thiol-modified (5′- or 3′-end) Oligonucleotide
  • 1M NaCl

Step I: Reduction of thiol-modified oligonucleotides (e.g. trityl-S- S-Oligo)

  1. Prepare a 0.15 M sodium phosphate buffer, pH 8.5 supplemented with 0.1 M DTT. Note that the pH in this reaction is important for proper reduction of oligonucleotide.
  2. Dissolve lyophilized oligonucleotide to a final concentration of 500 µM in H2O.
  3. Mix 50 µl of dissolved oligonucleotide with 450 µl sodium phosphate buffer.
  4. Incubate 1-2 hours at room temperature to reduce oligonuclotide.
  5. Separate reduced oligonucleotide from trityl-SH and DTT using a NAP 5 column operated in H2O, GE Healthcare.
  6. Final eluate from NAP 5 column will be 1ml in H2O with an approximate concentration of 25 µM.

Note: The exact concentration of final eluate in step 6 above can be measured with UV-VIS spectroscopy by measuring the absorbance at 260nm.

Step II: Conjugation of thiolated oligonucleotide to OligoREADY gold nanoparticles

  1. Resuspend one vial of lyophilized OligoREADY gold nanoparticle with 740 µl of H2O.
  2. Transfer into a 1.5 ml microcentrifuge tube.
  3. Add 160 µl of reduced thiolated oligonucleotide (25µM (0.025 nmol/µl) in H2O) as prepared above.
  4. Add 100 µl of 1M NaCl
  5. Incubate for at least 1 hour at room temperature to allow binding of the oligonucleotide to the gold surface. Longer incubation times may improve surface coverage.
  6. Centrifuge at the appropriate speed for your particular gold nanoparticle size (see table I) for 30 minutes to pellet your oligonucleotide gold conjugate.
  7. Remove supernatant
  8. Resuspend conjugate in 200 µl of storage buffer. The optical density of the particles should be 10 if a 100% recovery has been achieved.
  9. Common storage buffer: 10 mM sodium phosphate buffer, pH 7.0, 100 mM NaCl and 0.01% (w/v) NaN3.
  10. Measure optical density with a spectrophotometer and adjust concentration as desired.
  11. Store conjugate at +4°C

Table I. Recommended gold nanoparticle centrifugation settings. Values in the table below are for a 1 ml gold nanoparticle volume in a standard 1.5 ml microcentrifuge tube using a table-top centrifuge.

Gold Nanoparticle DiameterCentrifugation Force
5nmUse 100kDa MWCO Spin Columns
10nm22,000 x g *
15nm17,000 x g
20nm10,000 x g
30nm2,500 x g
40nm1,400 x g
50nm1,100 x g
60nm900 x g
70nm700 x g
80nm600 x g
90nm500 x g
100nm400 x g

*For 10nm gold nanoparticles the recovery is estimated to be approximately 50% at this particular speed. For better recovery, 1) use an ultracentrifuge to achieve higher speeds or 2) use 100kDa MWCO Spin Columns (if molecular weight of the conjugated protein is <100kDa).

Figure 2. 0.5% (w/v) agarose gel analysis of 50nm OligoREADY gold nanoparticles before and after conjugation with a thiol-modified oligonucleotide (20 bp). Gel was operated at 100V constant for in 0.5X TBE buffer for 30 minutes.

Introduction

Gold nanoparticles have many applications in biology and medicine. Gold nanoparticles are used as biosensors, cellular probes, drug delivery vehicles, or as optical contrast agents (1). To use gold nanoparticles for these specific applications, the ability to modify the surface is extremely important. A modification of the surface with polymers such as polyethylene glycol (PEG) and polyethylene oxides reduce non-specific binding, small molecules such as biotin and peptides and proteins can provide them specificity toward cellular targets in vitro and in vivo, and DNA enables them to be used for genetic detection. A key strategy to modifying the surface of the gold nanoparticles is with molecules that contain sulfur, nitrogen, or oxygen atoms as they have high binding affinity to gold atoms. As a result, thiolated-DNA and proteins adsorb onto the surface of the gold nanoparticles relatively easily. The design of Cytodiagnostics gold nanoparticles allows for the use of either adsorption to coat polymers or bio-recognition molecules on the surface, by covalent conjugation, or by using biological interactions (e.g., streptavidin-biotin). This provides greater versatility in the design of you gold nanoparticle system. This technical note provides a brief description of the current modification strategies and some of the emerging biomedical applications of these materials.

Surface Modification Strategies

PEGylated Gold Nanoparticles

PEG is a polyether molecule and is typically described by the molecular weight and whether they are linear, branched, star, or combed-shaped. PEG molecules can also be functionalized with thiols, amines, carboxylic acids, or alcohols. PEG molecules are coated onto gold nanoparticles by a sulfur-gold atom bond. Interestingly, coating of a dense layer of PEG onto gold nanoparticles has shown to reduce non-specific binding of proteins (2). It was recently shown that gold nanoparticles with greater than 0.96 PEG/nm2 is required to reduce non-specific binding and to inhibit their uptake into macrophage cells. Using these results, we designed PEGylated gold nanoparticles with the lowest non-specific cellular uptake. This is very important when using gold nanoparticles in biology where the particles are programmed to target specific molecules or cellular receptors. Non-specific protein binding can affect the specificity. In addition, our gold nanoparticle-PEG system contains protruding carboxylic acids or amines that allows other molecules to be conjugated to the surface by using the coupling agent 1-Ethyl-3-(3-dimethylaminopropyl)carbodiimide, better known as EDC. In this reaction, the gold nanoparticles is incubated with EDC and the biological molecule of interest for 2 hrs and then purified by centrifugation to remove excess biological molecules (see Tech Note 105 – Covalent conjugation to Cytodiagnostics Carboxylated Gold Nanoparticles for detailed procedure). These gold nanoparticle conjugates are then ready to be used for biological purposes.

Gold Nanoparticles Coated with Bio-Recognition Molecules

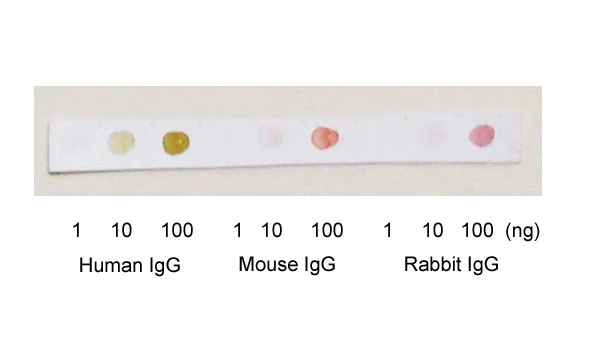
Gold nanoparticles cannot recognize specific biological targets without surface modification. It is well known that single-stranded DNA’s called oligonucleotides can recognize a complementary sequence, antibodies recognize antigens, and peptides recognize antibodies. By coating the surface of gold nanoparticles with oligonucleotides, antibodies, peptides, or other bio-recognition molecules, one is then able to recognize specific targets in solution, lateral flow, vertical flow, western blots (see figure 1), on/in cells, or in tissues in animals. Basically, these molecules provide gold nanoparticle with a biological function. Typically these bio-recognition molecules are coated onto the surface via direct adsorption or by covalent conjugation to the gold nanoparticle surface containing NHS, carboxylic acid or amine functional groups.

Figure 1. Immuno-dot blot assay for detection of human IgG antibodies using gold nanoparticles, silver nanoparticles and gold nanourchins (“spiky gold”) coated with bio-recognition molecules. Note how the difference in appearance (color) of the dots can be achieved using different types of noble metal protein conjugates varying in either shape or composition.


Heterogeneous Surface Design

Engineering a gold nanoparticle surface that contains PEG and bio-recognition molecules is ideal for their application. The PEG molecule prevents non-specific binding while the bio-recognition molecule provides biological specificity. Cytodiagnostics gold nanoparticle products enables researchers to design their nanoparticles in this manner, for optimum biological use.

Applications

Gold nanoparticles coated with PEG or/and bio-recognition molecules (BRM) has many applications, e.g. biosensors, cellular probes, drug delivery vehicles, or as optical contrast agents. Below, we provide some specific examples of how to use gold nanoparticle conjugates.

DNA Sensors

Single stranded DNA-coated onto gold nanoparticles can be used for detection of genetic material (3). In this application, single stranded oligonucleotide-coated gold nanoparticles are incubated with a DNA fragment of interest. If the fragment is complementary to the oligonucleotide sequence on the gold nanoparticles, particles are assembled together. As a result of this “aggregation” the color of the solution changes from red to blue because the surface plasmon is coupled when particles are in the aggregated state. The color change thus indicates a positive detection. Mutations can be detected by heating the sample. DNA de-hybridizes when heated and when a mutation is present in the sequence, the melting temperature is lowered. By measuring and comparing the temperature of a mutated sequence to a perfectly complementary sequence, one is able to detect whether a mutation is present or not. More complex schemes can also be designed to identify the location of a mutation within the DNA fragment analyzed.

Through years of experience, Cytodiagnostics has optimized protocols for conjugation of oligos to gold nanoparticles and we are proud to offer our OligoREADY™ conjugation kits for easy conjugation of thiolated oligonucleotides to gold nanoparticles with sizes in the range of 5-100nm.

Applications in In Vivo Cancer Research

The gold nanoparticle PEG/BRM system can be designed to selectively target tumors and bind to cancerous cells. Interestingly, PEGylated gold nanoparticles can target tumors by a passive mechanism alone. An advantage of the protective PEG-layer on the gold nanoparticles is that it has been shown to reduce macrophage uptake. Macrophages are part of the reticuloendothelial system that removes foreign materials from the blood. The PEGylated layer reduces the interaction of the gold surface with blood proteins thereby minimizing non-specific macrophage uptake. This allows the nanoparticles to reside in the blood for long-term, which allows for a greater chance of tumor extravasation. If coated with a drug or imaging agent (see our Fluorescent Gold Nanoparticles), the gold nanoparticles can be used as a visualization tool as well as a delivery vehicle to the tumor. Another method of targeting tumors is by coating the gold nanoparticles with a bio-recognition molecule that recognizes receptors on tumor cells, the extracellular matrix, or blood vessels, i.e. active targeting. The advantage of using gold nanoparticles is that one can control the delivery efficiency by the size, shape, or surface chemistry (4).

Nanotoxicology

One of the key questions facing researchers is to understand how the size, shape, and surface chemistry (known as the physico-chemical properties) affect how nanoparticles distribute in the cell and body, and whether specific nanomaterial designs cause toxicity. Gold nanoparticles are ideal platforms to perform these studies on because they can be synthesized and tuned with a narrow size distribution. Further, designs with different shapes and surface chemistries can be readily achieved. This allows one to systematically evaluate their behavior in biological systems. By performing such studies, one is then able to identify the designs with the lowest toxicity, which subsequently can be selected for the final application(s).

Cellular Probes

Gold nanoparticles scatter light, and when using a dark field microscope to image them, they appear as bright spots (similar to fluorescence). A unique advantage is that the dark field signal does not photobleach like fluorescence from dyes. By labeling gold nanoparticles with bio-recognition molecules such as an antibody to a cell surface receptor etc. cells can thus conveniently be targeted and imaged. In addition, low-level target detection can be improved by using silver enhancement of bound gold nanoparticles.

Summary

The surface is the interface of the nanoparticle with the environment and the ability to manipulate the surface of gold nanoparticles is essential for their use. Here, we present a product with a PEGylated surface that reduces non-specific binding to the gold surface and further functionalization with bio-recognition molecules provides an easy strategy to both target and visualize cellular targets and intracellular processes.

References

  1. Sperling, R. A.; Gil, P. R.;Zhang, F.; Zanella, M.; Parak, W. J.. Biological Applications of Gold Nanoparticles, Chemical Society Reviews, 2008, 37, 1896-1908.
  2. Walkey, C. D.; Olsen, J. B.; Guo, H.; Emili, A.; Chan, W. C. W. Nanoparticle Size and Surface Chemistry Determine Serum Protein Adsorption and Macrophage Uptake, Journal of the American Chemical Society, 2012, 134, 2139.
  3. Elghanian, R; Storhoff, J. J.; Mucic, R. C.; Letsinger, R. L.,; Mirkin, C. A. Selective Colorimetric Detection of Polynucleotides Based on the Distance Dependent Optical Properties of Gold Nanoparticles, Science, 1997, 277, 1078.
  4. Chou, L; Chan, W. C.W. Fluorescence-Tagged Gold Nanoparticles for Rapidly Characterizing the Size-Dependent Biodistribution in Tumor Models, Advanced Healthcare Materials, 2012, DOI: 10.1002/adhm.201200084.

Background

Gold nanoparticle conjugates have been used for a wide range of biological applications including the use as probes in light and electron microscopy. Stable gold nanoparticle conjugates can readily be prepared by passive adsorption due to electrostatic and hydrophobic interactions between the protein and the surface layer of the colloidal gold. A process that generally is optimally achieved at a pH close to the pI of the protein to be conjugated.

An important parameter to also consider when preparing gold nanoparticle conjugates is the amount of protein bound to the gold colloid. If too little protein is adsorbed to the gold surface, aggregation occurs upon addition of electrolytes present in standard buffers. A titration is therefore performed to determine at which protein concentration saturation and colloidal stability is reached.

Materials

  • Standard gold nanoparticles
  • 10% (w/v) NaCl
  • 10% (w/v) Bovine Serum Albumin (Millipore Sigma Cat. #)
  • Purified protein to be conjugated (5 mg/ml)
  • 0.5X phosphate-buffered saline (PBS)
  • 0.1M sodium phosphate buffers with pH ranging from pH 6.5-pH 7.8
  • 0.1M borate buffers with pH ranging from pH 8.0-pH 9.4
  • Conjugate resuspension buffer – 1XPBS, 1% BSA, 20% glycerol (optional)
  • UV-VIS spectrophotometer

Procedure

Titration Procedure (Optimization of pH and Amount of Protein)

  1. Transfer 0.5ml of gold nanoparticle solution to a microcentrifuge tube.
  2. Adjust to desired pH by adding 20ul of either 0.1M sodium phosphate or 0.1M borate buffer of a specific pH.
  3. Transfer 10ul of protein solution (0-5mg/ml, diluted in 0.5X PBS) to a separate microcentrifuge tube.
  4. With a pipette rapidly add the pH-adjusted gold nanoparticle solution to the vial with protein.
  5. Incubate for 10 minutes at room temperature
  6. Add 0.5ml of 10% NaCl to the vial
  7. Incubate for 5-10 minutes at room temperature.
  8. Samples with suboptimal pH and protein quantities will rapidly aggregate upon addition of NaCl which can be observed by a colour change of the solution (from red to purple/blue). No colour change will occur in samples with optimal conjugation conditions.

Preparation of Gold Conjugate (Scale-Up Reaction)

  1. Transfer amount of gold nanoparticles needed for your application from the stock to a new tube.
  2. Add protein amount as determined above plus an additional 10%.
  3. Incubate for 30 minutes at room temperature while stirring.
  4. Centrifuge the solution for 30 minutes at the appropriate speed for the gold nanoparticle size used. For more information on appropriate centrifugation speeds of gold nanoparticles of different sizes, see Gold Nanoparticle Handling and Storage.
  5. Resuspend the pellet in PBS supplemented with 0.1% BSA or 1% PEG.
  6. Store at 4°C until use

References

Thobhani, S., Atree, S., Boyd, R., Kumarswami, N., Noble, J., Szymanski, M., Porter, R.A. (2010) – Bioconjugation and characterization of gold colloid-labelled proteins Journal of Immunological Methods 356, 60-69

One of the greatest attributes of noble metal nanoparticles are their ability to create high avidity bio-recognition conjugates through the attachment of multiple antibodies (or other proteins) to their surfaces. This can either be achieved through passive non-specific adsorption of an antibody (protein) to the nanoparticle surface, or through a more controllable approach, covalent conjugation.

Regardless if you are using passive adsorption or covalent conjugation the factor limiting the amount of antibody (protein) that can be bound to the nanoparticles is the available surface area of the nanoparticles themselves. For example, a 100nm gold nanoparticle has a surface area of 31,400 nm2 and can accommodate far more proteins than a 10nm particle having only a surface area of 314 nm2. For a standard rabbit derived antibody (IgG) with an approximate molecular weight of 150 kDa and an approximate docking area of 33.4 nm2 a 100nm particles can theoretically bind a maximal 936 IgGs per particle and 12 IgGs per 10nm, a 78 fold difference.

Table I below list the theoretical number of IgG, Streptavidin, and Protein A molecules that can bind a nanoparticle of a given size. As mentioned above the theoretical surface density is based upon the docking area of each protein and the available surface area on each nanoparticle that can accommodate the protein.

Due to their similar surface properties this table is valid for our gold, silver, and gold nanourchin conjugates.

Table I. Estimated protein density per noble-metal nanoparticle (gold nanoparticle, silver nanoparticles or gold nanourchins).

Gold Nanoparticle SizeConjugated ProteinMaximum Number of Proteins/ParticlesMolar Protein Concentration (@ OD=10)Mass Protein Concentration (@ OD=10)
5nmIgG32.7uM405 ug/ml
Streptavidin54.5uM238 ug/ml
Protein A43.6uM151 ug/ml
10nmIgG121.2uM180 ug/ml
Streptavidin202.0uM106 ug/ml
Protein A161.6uM67 ug/ml
15nmIgG270.73uM110 ug/ml
Streptavidin451.2uM63 ug/ml
Protein A360.97uM41 ug/ml
20nmIgG480.52uM78 ug/ml
Streptavidin800.87uM46 ug/ml
Protein A640.69uM29 ug/ml
30nmIgG860.26uM39 ug/ml
Streptavidin1800.43uM23 ug/ml
Protein A1440.34uM14 ug/ml
40nmIgG1500.18uM27 ug/ml
Streptavidin3200.30uM16 ug/ml
Protein A2560.24uM10 ug/ml
50nmIgG2340.14uM21 ug/ml
Streptavidin5000.23uM12 ug/ml
Protein A4000.18uM7.6 ug/ml
60nmIgG3370.11uM17 ug/ml
Streptavidin7190.18uM9.5 ug/ml
Protein A5750.15uM6.3 ug/ml
80nmIgG59978nM12 ug/ml
Streptavidin1280130nM6.9 ug/ml
Protein A1024100nM4.2 ug/ml
90nmIgG75768nM10 ug/ml
Streptavidin1617110nM5.8 ug/ml
Protein A129490nM3.8 ug/ml
100nmIgG93660nM9.0 ug/ml
Streptavidin2000100nM5.3 ug/ml
Protein A160079nM3.3 ug/ml

Background
Gold nanoparticles loaded with DNA oligonucleotides have many practical uses in analytical chemistry and biotechnology including: biosensing, drug delivery, cell imaging and for fundamental understanding of nanoscience.

Classic methods to conjugate DNA to the surface of gold nanoparticles such as “salt-aging” are laborious and time-consuming processes. In contrast, Cytodiagnostics Maleimide-Activated Gold Nanoparticle Conjugation Kits and OligoREADY™ Conjugation Kits have been optimized for high efficiency one-step conjugation of thiol-containing ligands such as oligonucleotides to gold nanoparticles. Conjugation of the oligonucleotide is achieved by the formation of a strong and stable gold-thiol bond without any additional linkers for OligoREADY™ and through a PEG-linker for maleimide particles. The method described below is suitable for determining the oligonucleotide density of conjugates prepared with all conjugation strategies described above.

For several downstream applications it might be necessary to estimate the number of conjugated oligonucleotides that are present per gold nanoparticle in you conjugate. One method of doing this is by functionalizing fluorophore labeled version of your oligonucleotide onto the surface of the gold and incubating with DTT to displace the DNA from the surface of the gold and measuring fluorescence signal in comparison to a standard curve. The result obtained is the absolute number of the oligonucleotides per gold nanoparticle in solution.

Practically, this is done by incubating the fluorophore-labeled DNA functionalized gold nanoparticles with DTT. When mixed, the -SH groups on the DTT displace the -SH group on the DNA molecule (or PEG-SH-linker) from the surface of gold, forming a dense monolayer and freeing the DNA into solution. Initially, the fluorescent signal produced by the fluorophore is quenched by the gold when functionalized, but once the oligonucleotide is cleaved by the DTT, the fluorescent signal is freed from the quenching power of the gold nanoparticles and can be measured by a fluorometer. The method to achieving density of DNA on any size of gold nanoparticles is outlined below.

Materials and Equipment
1M Dithiothreitol (DTT)
Oligonucleotide Conjugated Gold Nanoparticles
Oligonucleotide stock solution for creating standard curve
Fluorometer
Procedure
Dilute stock DTT solution (usually 1M) to 75mM with H2O.
Create a standard curve (Ex. 0nM – 1000nM for a 20nm DNA-functionalized gold nanoparticles) using the same DNA as conjugated to the gold nanoparticles, diluting the DNA using 75mM DTT (9 DTT : 1 DNA, 100L total volume).
Mix the oligo labeled gold nanoparticles with the 75mM DTT (9 DTT : 1 DNA, 100L total volume).
Incubate the standard curve* solutions and the gold nanoparticle solution(s) until the next day, covering all solutions in foil to prevent light exposure to fluorophores.
Measure the fluorescence signals of all solutions using a fluorometer.

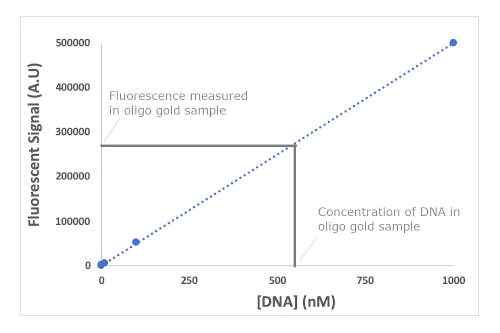
* The standard curve (see figure 1) is used to determine concentration of oligonucleotides on the surface of the gold. Dividing by the concentration of the gold nanoparticle solution will give you the total # of DNA/gold nanoparticle.

Figure 1. Example of a standard curve generated from multiple DNA samples of various concentrations in step 2 above. The total DNA concentration in your oligonucleotide gold conjugate sample can be derived from the standard curve by extrapolating the fluorescent signal measured to the corresponding DNA concentration on the standard curve (grey lines in graph).

Common Applications of Gold Nanoparticles

While rapid assay methods have made a major impact on a variety of diagnostic testing over the last twenty years only a handful of development can make the claim to have taken testing out of the laboratory.

One that can, and is in widespread use as a result, is the lateral flow immunoassay test, also known as the immunochromatography assay, or strip test. Like many of the best ideas, lateral flow immunoassays take clever and sophisticated technology and turn it into something so simple to operate that almost anyone can use it.

The Technology

The basic technology that underlies lateral flow immunoassays was first described in the 1960s, but the first real commercial application was Unipath’s Clearview home pregnancy test launched in 1988. Since then, this technology has been employed to develop a wide and ever-growing range of assays for clinical, veterinary, agricultural, food industry, bio-defence and environmental applications.

Strip assays are extremely versatile and are available for an enormous range of analytes from blood proteins to mycotoxins and from viral pathogens to bacterial toxins. Assays has even been developed for wine producers to assess the amount of botrytis rot in newly harvested grapes as well as for use in the clinical lab identifying cardiac markers. This shows the vast range that this technology can be applied too.

Lateral flow immunoassays are essentially immunoassays adapted to operate along a single axis to suit the test strip format. There are a number of variations of the technology that have been developed into commercial products one being Vertical Flow Technology, but they all operate using the same basic principle.

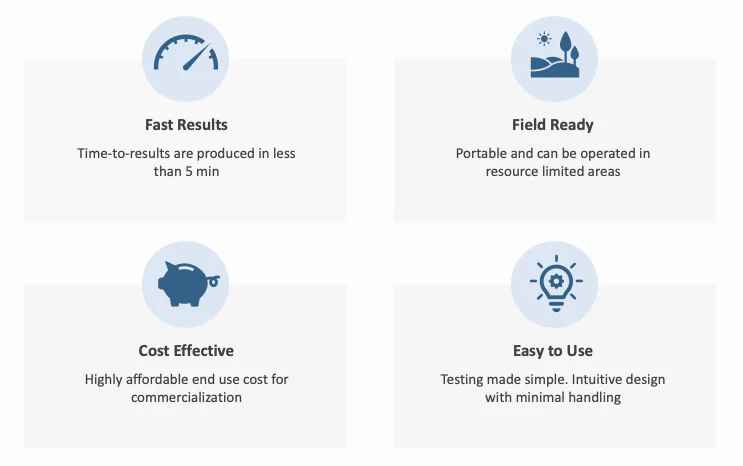
Figure 1. Advantages of lateral flow assays.


How Does a Lateral Flow Assay Work?

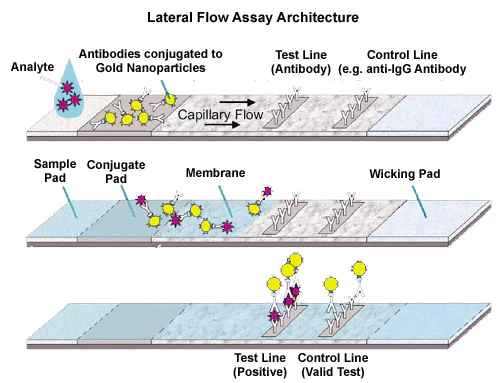
A typical lateral flow rapid test strip consist of the following components:

Sample pad – an adsorbent pad onto which the test sample is applied.

Conjugate or reagent pad – this contains antibodies specific to the target analyte conjugated to coloured particles (usually colloidal gold nanoparticles, or latex microspheres).

Reaction membrane – typically a nitrocellulose or cellulose acetate membrane onto which anti-target analyte antibodies are immobilized in a line that crosses the membrane to act as a capture zone or test line (a control zone will also be present, containing antibodies specific for the conjugate antibodies).

Wick or waste reservoir – a further absorbent pad designed to draw the sample across the reaction membrane by capillary action and collect it.

The components of the strip are usually fixed to an inert backing material and may be presented in a simple dipstick format or within a plastic casing with a sample port and reaction window showing the capture and control zones.

Figure 2. Principle of lateral flow assay.

Cytodiagnostics manufactures a full product line of gold nanoparticles (colloidal gold) for use in a variety of lateral flow assays. Our diverse product line of different type of nanoparticles offers you products with a narrow size distribution (CV of less than 12%), exceptional adsorption and conjugation properties and with greater than 95% spherical particles. In addition, our batch to batch variability is extremely low (+/- 2nm), which assures that you our customer will always end up with a product within the specified size range that you ordered.

The high shape uniformity of our colloidal gold will minimize the variability within your assay by e.g. allowing control over the available surface area while absorbing or covalently conjugating proteins to our gold nanoparticles. It will also ensure a more uniform flow rate across your membrane for improved reproducibility and overall results.

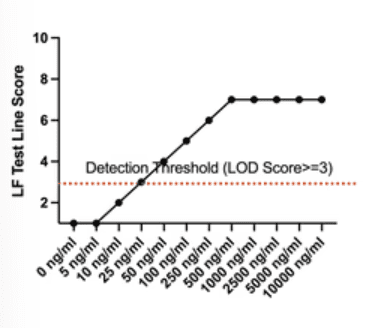
A lateral flow score card provides the opportunity to score the intensity of test lines in a lateral flow assay more consistently over time and between users.

Proper use in conjunction with a standard curve also gives you the opportunity to obtain semi-quantitative data from your lateral flow assay.

Below is an example score card with a 10-grade intensity scale similar to the score card used by Cytodiagnostics scientists during lateral flow development. The figure above shows example data obtained by using the score card.

Background

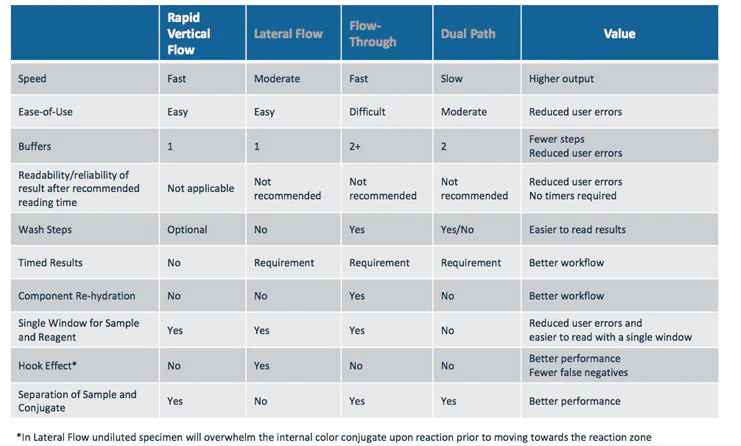
Vertical flow immunoassays rely on the same basic principles as the more common lateral flow immunoassay format with some modifications. The most apparent difference between the two methods being the vertical and lateral flow of fluid. However, vertical flow technology has several advantages over traditional lateral flow assays with the most significant being the reduced assay time (<5 minutes), table I.

Vertical flow immunoassays can be used for rapid detection of an antigen(s) in a sample of interest. Samples can come from a wide range of application areas such as clinical, veterinary, agricultural, food, bio-defence and environmental industries. Detection sensitivity is generally in the lower nanogram per ml range even in complex sample matrices.

Table I. Features and benefit of rapid vertical flow technology compared to lateral flow and other rapid flow type tests.

How does a Vertical Flow Assay Work

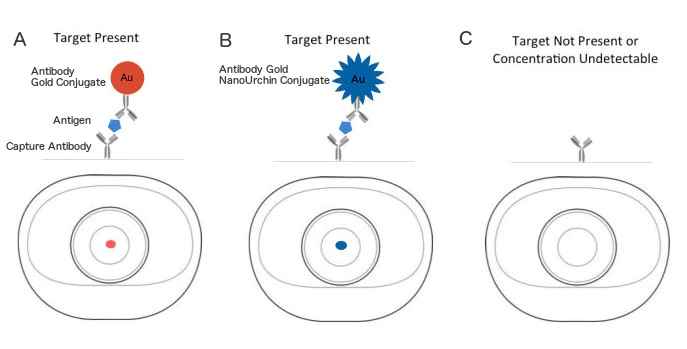
As with lateral flow, vertical flow immunoassays rely on the immobilization of a capture antibody on a reagent pad to which the sample of interest (with or without antigen to be detected) is applied. Detection of the bound antigen is subsequently achieved through the binding of an antigen specific antibody gold conjugate. This step completes a sandwich consisting of a capture antibody, an antigen and finally the gold conjugate and results in a direct and permanent visually detectable red coloured dot indicating the presence of the antigen, figure 1.

Of interest is that alternative colour of detection can easily be achieved by using a different type of nanoparticle conjugate probe for detection. One example being antibody conjugated gold nanourchins, which will yield a blue coloured dot upon positive detection in the assay.

Figure 1. Illustration of the appearance of the Miriad™ vertical flow cartridge after applying a gold conjugate (A) or a gold nanourchin conjugate (B) when target is present (A, B) and not present (C) in the sample analyzed.


Multiplexing Capabilities in Vertical Flow Immunoassays

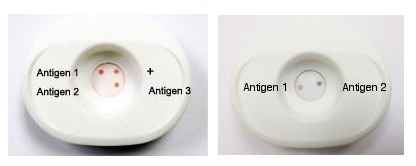
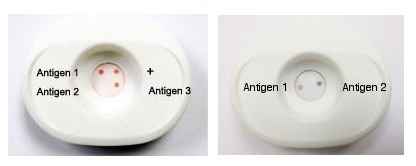
Vertical flow technology also allows for easy multiplexing. In the Miriad™ vertical flow test cartridges distributed by Cytodiagnostics Inc., the presence of 4 targets can be evaluated simultaneously in a single sample in 5 minutes or less.

Multiplexing is easily achieved by spotting capture antibodies against different antigens at pre-determined locations and/or patterns on the membrane. For easier visualization this multiplexing can also be coupled with nanoparticle probes of different colours, e.g. using a gold conjugate and a gold nanourchin conjugate with red and blue detection colours, respectively.

Figure 2. Multiplex detection in a vertical flow immunoassay. Left image shows positive detection of 2 out of 3 antigens (red dots) and the control. The right image shows positive detection of two different antigens using two nanoparticle probes with different colours (red: gold nanoparticles, blue: gold nanourchins.

Immunoblotting Using Noble Metal Nanoparticle Conjugates

Due to the relative ease of preparing antibody conjugates of noble metal nanoparticles such as gold and silver and the straightforward detection by naked eye without prior development procedures, these probes have found great use in many assays. Applications include rapid tests such as lateral flow, vertical flow, western blots and dot-blot assays. In addition, the unique optical properties of each noble metal nanoparticle type allows for generating secondary probes with different colours that can be utilized for colorimetric multiplexing, figure 1.

When membranes of blotted proteins are probed with a noble metal protein conjugate such as a secondary gold conjugate, the presence of a target protein is indicated with a red colour upon binding of the nanoparticle probe, figure 1. When combined with silver enhancement (i.e. deposition of silver onto the bound gold conjugate) sensitivity in western blot and dot-blot applications rivals that of colorimetric detection methods. In addition, secondary noble metal nanoparticle protein conjugates adapt well to standard western blot protocols and little changes are necessary to your current detection scheme.

Immunoblotting with noble metal nanoparticle protein conjugates have several advantages over traditional detection probes such as:

  • No development required for detection
  • No expensive imaging equipment required for detection
  • Allows for colorimetric multiplexing

Below is a standard dot-blot protocol for detection of an antigen on a membrane using a secondary gold conjugate. The same protocol can be used with gold nanourchins, silver nanoparticles, and alloy nanoparticle protein conjugate probes.

Standard Immunogold Dot-Blot Protocol

(Adapted from Moeremans et al. [1])

  1. Spot one microliter drops of a serial dilution of your protein (0.1 – 100 ng) in PBS supplemented with 50 ug/ml of BSA on nitrocellulose or PVDF membrane.
  2. Let protein drops dry into the membrane.
  3. Block Membrane for 30 minutes using 1% (w/v) dry milk in 1X PBS at room temperature.
  4. Incubate with primary antibody for 2 hours at room temperature.
  5. Wash membrane 3×5 minutes with blocking solution prepared as above.
  6. Incubate for 2 hours (or longer for increased sensitivity) with secondary gold conjugate diluted 1:10 (OD=0.3) with 0.2% dry milk. Note: See Tech Note #102 for preparation of a gold conjugate.
  7. Wash 3×5 minutes as above.
  8. Dry membrane and record data.
  9. (OPTIONAL) Proceed with silver enhancement to improve sensitivity.

Figure 1. Example dot-blot assay for Cytodiagnostics streptavidin gold conjugate (top left) and our streptavidin silver conjugate (top right) before and after enhancement using Cytodiagnostics silver enhancement kit for membranes. Bottom picture illustrates simultaneous multiplex detection of three different antigens using a mixture of noble metal nanoparticle conjugates with different optical properties, i.e. anti-human IgG 30nm gold/silver (20/80) alloy conjugate (green), a-mouse IgG 30nm gold/silver (80/20) alloy conjugate (red) and a a-rabbit IgG 40nm gold conjugate (purple).

Figure 2. Multiplex detection in a vertical flow dot blot immunoassay. Left image shows positive detection of 2 out of 3 antigens (red dots) and the control. The right image shows positive detection of two different antigens using two nanoparticle probes with different colours (red: gold nanoparticles, blue: gold nanourchins.

Figure 3. Western blot detection of purified actin using a rabbit anti-actin primary antibody followed by secondary detection using a 10nm anti-rabbit IgG gold conjugate and enhancement using Cytodiagnostics silver enhancement kit for membranes.

Silver Nanoparticles

Product Selection Guides

Choose a Silver Nanoparticle Product Based on Your Particular Application

ApplicationSilver Nanoparticle Size RangeSurface ChemistryBenefits
Protein Conjugation10nm-100nmStandard (citrate)Quick
NHSCovalent conjugation to primary amines, increased conjugate stability, less non-specific protein binding.
CarboxylCovalent conjugation to primary amines, increased conjugate stability, less non-specific protein binding.
StreptavidinConjugation to biotinylated ligands.
Modification with thiolated ligands10nm-100nmStandard (citrate-coated)Classic starting material, no additional stabilizers added.
Oligonucleotide Conjugation10nm-20nmStandard (citrate)Ideal for conjugation of thiol-modified oligos to small particle sizes (10nm-20nm). Does not work well for larger particles.
10nm-100nmNHSIdeal for covalent conjugation of amine-modified oligos. Final conjugate will have a PEG-linker between oligo and silver surface.
Immunoblotting/Western Blot10nm-30nmSecondary Antibody Silver ConjugatesColorimetric detection. Permanent label
Immunohistochemistry10nm-40nmSecondary Antibody Silver ConjugatesHigh contrast label
Cellular Uptake 30-80nmStandard (citrate-coated)Non-specific cellular uptake
Darkfield Microscopy50nm-100nmSilver Conjugates
Lateral Flow/Dip-Stick Assays20nm-80nmStandard (citrate-coated)Ideal for generation of silver conjugates through passive adsorption of antibodies to the silver nanoparticle surface.
NHSIdeal for covalent conjugation of antibodies to silver nanoparticles.
Silver ConjugatesPre-made secondary antibody conjugates
Tumor Targeting30nm-80nmmethyl (methoxy)-PEGCan in some cases be used for passive targeting of certain tumors in vivo. Inert material with low non-specific protein binding in serum.
Light Microscopy10nmSilver ConjugatesAbility to label tissue sections for both light and electron microscopy. Alternative to peroxidase and PAP-based stains. Sensitivity can be enhanced with silver enhancement techniques.
ELISA5nm-30nmSilver ConjugatesColorimetric Detection

Properties, Characterization and Handling of Silver Nanoparticles

Introduction

Silver nanoparticles (colloidal silver) have unique optical, electronic, and antibacterial properties, and are widely used in areas such as biosensing, photonics, electronics, and antimicrobial applications.

Most applications in biosensing and detection exploit the optical properties of silver nanoparticles, as conferred by the localized surface plasmon resonance effect. That is, a specific wavelength (frequency) of incident light can induce collective oscillation of the surface electrons of silver nanoparticles. The particular wavelength of the localized surface plasmon resonance is dependant on the silver nanoparticle size, shape, and agglomeration state.

Figure 1 shows the plasmon resonance spectra of different sizes of Cytodiagnostics silver nanoparticles, as measured with UV-visible spectroscopy. As the particle size increases from 10 to 100nm, the absorbance peak (lambda max) increases from 400nm to 500nm, and broadens in width. For particles of greater size, especially above 80nm, a secondary peak at lower wavelength becomes apparent, which is a result of quadrupole resonance, in addition to the primary dipole resonance.

Figure 1. Silver nanoparticle size dependant surface plasmon resonance. Note the red-shift of the absorption maximum as the gold nanoparticle size increases.

The aggregation state of silver nanoparticles also has significant effect on their optical properties. This fact can be used to monitor the stability of silver nanoparticles, both over time, and upon addition of salt-containing buffers, which at high enough concentrations cause particle aggregation. As shown in the absorbance spectra in Figure 2, aggregation is indicated by a decrease in the primary peak, and an increase in the red region.

Figure 2. Visual appearance and UV-VIS spectra of monodisperse (A) and sodium chloride (NaCl) induced agglomeration (B) of 10nm silver nanoparticles.


Comparison of Silver Nanoparticles vs. Gold Nanoparticles

Both silver nanoparticles and gold nanoparticles are commonly employed in optical detection for their surface plasmon resonance effect. The plasmon excitation efficiency of silver nanoparticles is known to be even more pronounced than that of gold nanoparticles, as shown in their stronger, sharper plasmon resonance peaks at the same particle concentration. Silver nanoparticles thus can render better sensitivity for some applications, such as localized surface plasmon resonance or surface enhanced Raman scattering detection.

Silver nanoparticles may also be advantageous over gold nanoparticles, when used in combination with fluorescence emission detection. Most fluorophores emits at a wavelength above 500 nm. However, the plasmon resonance absorbance of gold nanoparticles is primarily in the range of 500-600 nm, and hence can quench the detectable fluorescence to some extent, when the fluorescent dyes are close to the particle surface. This issue of fluorescence quenching is minimized for silver nanoparticles, as their plasmon resonance absorbance is mostly below 500 nm, with little overlapping with the emission wavelength of most fluorescent dyes. Figure 3 shows images of fluorescent gold and silver nanoparticles, labeled with the same amount of a 633nm emitting fluorescent dye. The fluorescent signal from silver is about 4 times stronger than that of gold.

Figure 3. Gold (A) and silver nanoparticles (B) surface-modified with the same amount of a 633nm emitting fluorescent dye.


With their different wavelengths of plasmon resonance, silver and gold nanoparticles, or particles of different size or shapes, can also be used together for multiplexed detection, taking advantage of the extended range of detection spectrum. Figure 4 shows dark field microscope images of Cytodiagnostics silver nanoparticles, gold nanoparticles and gold nano-urchins.

Figure 4. This image highlights the difference in appearance between silver nanoparticles, gold nanoparticles and gold nanourchins in darkfield microscopy (top) and in a immuno-dot blot assay (bottom).


Table I. Summary of optical and physical properties of Cytodiagnostics silver nanoparticles of various sizes.

Storage

Store silver nanoparticles at 2-8°C and protected from light. Do NOT freeze. If frozen, the silver nanoparticles will irreversibly aggregate. Aggregation of silver nanoparticles is indicated by change in color of the solution and an increase in the absorption of light in the red part of the visible spectrum, as detailed in our Silver Nanoparticle Properties Tech Note.

When stored as specified, the colloidal silver is stable for at least one year.

Handling

Large silver nanoparticles, i.e., above 60 nm in size, might sediment over time but will not affect the performance of the silver nanoparticles. Prior to use, re-suspend the sedimented particles by swirling the container until a homogenous solution is obtained.

For optimal performance and stability of the product, silver nanoparticles should not be stored diluted from the original concentration or in a bottle or flask other than that the product is supplied in. Care should be taken to use clean storage containers if other than supplied with the product.

Washing of Silver Nanoparticles

Although it is not always necessary, washing of silver nanoparticles might be required for certain applications. Silver ions released from the silver nanoparticle surface may affect some applications. The easiest way to remove such possible contaminants from the silver nanoparticle solution is by centrifugation. Centrifugal force is dependent on the size of silver nanoparticles, as listed Table I.

Notes: To prevent the silver nanoparticles from aggregating, a non-ionic surfactant such as Tween 20 should always be added prior to centrifugation.

Since non-functionalized silver nanoparticles are sensitive to salt containing buffers, re-suspension should always be performed in ultra-pure water or 2 mM sodium citrate solution, to prevent irreversible aggregation.

Procedure

  1. Aliquot 1 ml of silver nanoparticle stock solution into 1.5 ml centrifuge tubes.
  2. Add Tween 20 to reach a final concentration of 0.025% (w/v).
  3. Centrifuge the silver nanoparticles for 30 minutes using appropriate G force, as shown in Table I below.
  4. Remove supernatant and re-suspend in desired volume of ultra-pure water or 2 mM sodium citrate solution.
  5. Vortex to re-disperse particles.

Table I. Appropriate G force for the centrifugation of silver nanoparticles. The conditions are based on centrifuging 1 mL of silver nanoparticles in a 1.5 ml microcentrifuge tube using a standard microcentrifuge.

Size (nm)Speed (x g)Time (min)
1021,00060
2017,00030
3011,00030
403,00030
501,80030
6090030
8050030
10030030

*For 10nm silver nanoparticles, recovery was about 50% at the specified condition. For better recovery, 1) use an ultracentrifuge to achieve higher G force; 2) use a Centricon Spin Column.

Conjugation and Modification of Silver Nanoparticles

Background

Silver nanoparticle conjugates are useful for a wide range of biological applications including bio-sensing and bio-imaging. Stable silver nanoparticle conjugates can be prepared by two general approaches, passive adsorption and covalent bonding.

Passive adsorption of a protein molecule onto silver nanoparticles is mediated by the electrostatic and hydrophobic interactions between the protein molecule and the surface layer of the colloidal silver. This process is maximally achieved at a pH close to the pI of the protein to be conjugated. Another important parameter is the amount of protein loading. If surface-adsorbed protein is not sufficient, aggregation occurs upon addition of electrolytes present in standard buffers. Therefore, a titration is required to determine the protein concentration for complete saturation and shielding of the silver nanoparticle surface.

However, some proteins may undergo disturbances to the tertiary structure upon passive adsorption, which may impair their affinity and/or specificity in molecular binding applications. To better preserve the activity of the conjugated protein an alternative approach can be used, i.e., covalently coupling protein molecules onto silver nanoparticles functionalized with carboxyl groups via a PEG-linker. The PEG-linker allows for more flexibility and also better accessibility of the conjugated protein to its antigen/substrate due to the inherent mobility of the PEG-linker and the increased distance from the gold surface. Further, the shielding polyethylene glycol (PEG) layer generally also result in conjugates with superior stability and less non-specific binding. Conjugation to these types of functionalized particles can be performed using straightforward carbodiimide (EDC/NHS) coupling chemistry.

Conjugation of Proteins Using Passive Adsorption

Materials and Equipment

  • Standard Silver Nanoparticles
  • 10% NaCl (w/v)
  • 10% Tween 20 (w/v)
  • 2mM sodium citrate tribasic dihydrate
  • 10X Phosphate Buffered Saline, 10X PBS
  • Bovine Serum Albumin (BSA)
  • UV-VIS Spectrophotometer

Procedure

Step 1. Determination of Optimal pH and Protein Concentration for Conjugation
  1. Aliquot 200 µl of silver nanoparticles into 1.5ml Eppendorf tubes (200 µl for each condition to be tested).
  2. Adjust the pH of the silver nanoparticle solution to the desired pH (optimal pH is generally close to the pI of the protein to be conjugated).
  3. Add between 0 and 50 µg of protein in 10 µl to the silver nanoparticles and mix well to determine the amount needed to saturate the silver surface.
  4. Incubate for 10 minutes at room temperature
  5. Add 200 µl of a 10% NaCl stock solution and incubate for 10 minutes at room temperature.
  6. Determine at which protein concentration the silver nanoparticle surface becomes saturated and no aggregation occurs upon addition of 10% NaCl by observing the color change and measuring the sample(s) using a UV-VIS spectrophotometer. Degree of aggregation can be measured by an increase in absorbance at 690nm and a decrease in absorbance at 405-480nm (particle size dependant, see silver nanoparticle properties) compared to that of the non-conjugated control particles.

Note: The amount of protein needed to saturate the silver colloid can also be determined and verified through agarose gel-electroporesis. Binding of protein to the silver nanoparticle surface changes the overall particle charge and size both of which will affect the migration pattern in the agarose gel.

Step 2. Scale-Up and Preparation of Final Silver Nanoparticle Conjugate
  1. Transfer the desired volume of silver nanoparticles to 1.5 ml Eppendorf tubes.
  2. Add Tween 20 to a final concentration of 0.025% (w/v).
  3. Centrifuge the solution to pellet the silver nanoparticles. For more information on appropriate centrifugation settings for silver nanoparticles of different sizes, see table I at the end of this document.
  4. Resuspend the silver nanoparticles with 2mM sodium citrate to the original silver colloid volume and concentration.
  5. Adjust the pH of the silver nanoparticle solution as determined in the titration procedure above.
  6. Add the appropriate amount of protein as determined in the titration procedure above plus an additional 10%.
  7. Incubate for 60 minutes at room temperature on a rotary shaker/rocker.
  8. Centrifuge the vial for 30 minutes at the appropriate speed for the silver nanoparticle size that you are conjugating to pellet the particles and remove the supernatant.
  9. Resuspend the pellet in 1X PBS supplemented with 1% BSA (w/v).
  10. Sonicate briefly in a sonicator bath to aid in dispersion if particles are partially agglomerated.
  11. Validate the functionality of the final silver conjugate. For a suggested protocol for evaluation of functionality using a immuno-dot blot assay please see Immunoblotting with Gold Nanoparticles.
  12. Store the silver conjugate at 4 degrees Celsius until use.

Covalent Conjugation of Proteins to Carboxylated Silver Nanoparticles

Materials and Equipment

  • Carboxyl Functional Silver Nanoparticles (conc. 125 OD in ddH2O)
  • 1-Ethyl-3-[3-dimethylaminopropyl]carbodiimide hydrochloride (EDC)
  • N-hydroxysulfosuccinimide (Sulfo-NHS)
  • Protein to be conjugated (1mg/ml in 1XPBS)
  • Bovine Serum Albumin (BSA)
  • Activation Buffer: 10mM 2-(N-morpholino)ethanesulfonic acid (MES), pH 5.5
  • Coupling Buffer: 1X Phosphate Buffered Saline (1XPBS)
  • Washing Buffer: 1X Phosphate Buffered Saline, 0.05% Tween 20 (PBST)

Procedure

  1. Prepare a fresh EDC/NHS solution in activation buffer at a concentration of 30 and 60 mg/ml, respectively.
  2. Transfer 10 µl of carboxyl silver nanoparticles from stock solution and mix with 10 µL of EDC/NHS solution.
  3. Incubate for 30 minutes at room temperature to activate the particle surface.
  4. Add 1 ml of washing buffer and mix thoroughly.
  5. Pellet the activated silver nanoparticles by centrifugation for 30 minutes at the appropriate speed for the particular silver nanoparticle size you are conjugating. See table I below for recommended centrifugation speeds.
  6. Remove supernatant taking care not to disturb the pellet.
  7. Add 10 µl of protein to be conjugated (1 mg/ml in 1X PBS)
  8. Incubate for 2-4 hours on a rotary shaker/rocker to conjugate the protein to the activated silver nanoparticle surface.
  9. Add 1 ml of PBST and mix thoroughly.
  10. Pellet the silver conjugate as in step 5 above.
  11. Remove supernatant and resuspend the conjugate with 157 µl of 1X PBS supplemented with 1% BSA (w/v).
  12. Sonicate the conjugate briefly in a sonicator bath to aid in dispersion.
  13. Validate the functionality of the final silver conjugate. For a suggested protocol for evaluation of functionality using a immuno-dot blot assay please see Tech Note #103-Immunoblotting with Gold Nanoparticles for procedure and Figure 1 below for an example result.
  14. Store the silver conjugate at 4 degrees Celsius until use.

Figure 1. Validation of functionality (biotin binding) of a streptavidin silver nanoparticle conjugate using an immuno-dot blot assay.


Table I. Appropriate G force for the centrifugation of silver nanoparticles. The conditions are based on centrifuging 1 mL of silver nanoparticles in a 1.5 ml microcentrifuge tube using a standard microcentrifuge.

Size (nm)Speed (x g)Time (min)
10>21,00060*
2017,00030
3011,00030
403,00030
501,80030
6090030
8050030
10030030

*For 10nm silver nanoparticles, recovery was about 50% at the specified condition. For better recovery, 1) use an ultracentrifuge to achieve higher G force; 2) use a Spin filter column with a 100kDa MWCO.

Introduction

Compared to carboxylated nanoparticles that require activation with EDC/NHS prior to conjugation, Cytodiagnostics NHS-activated gold nanoparticles, NHS-activated silver nanoparticles, and NHS-activated gold nanourchins are all shipped pre-activated in a conjugation-ready format. No manipulation of the nanoparticles is required prior to conjugation, which significantly streamlines the workflow, and more importantly, improves overall conjugate quality. As with carboxylated nanoparticles these pre-activated nanoparticles are suitable for conjugation of proteins and other amine containing ligands.

A recommended starting protocol for conjugation can be found below. Note that the amount of protein added may need to be optimized for your particular protein.

Materials

  • NHS-Activated Silver Nanoparticles
  • Protein Resuspension Buffer (supplied with particles above)
  • Reaction Buffer (supplied with particles above)
  • Quenching Solution (supplied with particles above)
  • Conjugate storage buffer: 20mM Tris (pH 8.0), 150mM NaCl supplemented with 1% (w/v) BSA.

Procedure

  1. Allow all reagents to warm to room temperature before use.
  2. Dilute (or dissolve) your protein/antibody to a final concentration of 0.5 mg/ml using the supplied protein re-suspension buffer.
  3. In a microcentrifuge tube combine your diluted protein with reaction buffer according to table I below.
  4. Transfer 90 µl of your protein/reaction buffer mix prepared in step 2 to one of the vials containing lyophilized NHS-activated silver nanoparticles and immediately mix well by pipetting up and down*.
  5. Incubate the vial at room temperature for 2 hours.
  6. Add 10 µl of quencher solution to the vial to stop the reaction.
  7. Using a microcentrifuge, centrifuge the vial for 30 minutes using the appropriate speed for the nanoparticle size you are using according to table II below.
  8. Remove supernatant containing unbound protein.
  9. Add 100 ul of conjugate storage buffer* to the vial to re-suspend your conjugate.
  10. Record the UV-VIS spectra of the conjugate using a spectrophotometer, and dilute to desired optical density using conjugate storage buffer.
  11. Store your protein conjugate at 4°C until use.

* Note: Do not resuspend lyophilized NHS-activated nanoparticles in buffer prior to addition of your protein. NHS rapidly hydrolyzes in aqueous solution and may result in loss of conjugation efficiency.

Table I. Quantities of each reagent to mix and add to a single vial of lyophilized NHS-activated nanoparticles.

3 or 10 Reaction NHS KitsMIDI NHS Kits
Reaction Buffer84 ul840 ul
Diluted Protein Solution24 ul240 ul
Total Volume108 ul1080 ul

Table II. Recommended centrifugation speeds for protein conjugated silver nanoparticles. A centrifugation time of 30 minutes is generally sufficient for a 1 ml sample in a 1.5 ml microcentrifuge tube.

Silver Nanoparticle Diameter Centrifugation Force (x g)
10nm21,000
20nm17,000
30nm11,000
40nm3,000
50nm2,000
60nm900
80nm500
100nm300

*For 10nm silver nanoparticles the recovery is estimated to be approximately 50% at this particular speed. For better recovery, 1) use an ultracentrifuge to achieve higher speeds or 2) use 100kDa MWCO Spin Columns.

SUPPORT

outstanding technical support

PRODUCT

we offer a full product guarantee

DELIVERY

we offer free delivery to UK universities and non profit organisations