Silver Nanoparticle Properties
Introduction
Silver nanoparticles (colloidal silver) have unique optical, electronic, and antibacterial properties, and are widely used in areas such as biosensing, photonics, electronics, and antimicrobial applications.
Most applications in biosensing and detection exploit the optical properties of silver nanoparticles, as conferred by the localized surface plasmon resonance effect. That is, a specific wavelength (frequency) of incident light can induce collective oscillation of the surface electrons of silver nanoparticles. The particular wavelength of the localized surface plasmon resonance is dependant on the silver nanoparticle size, shape, and agglomeration state.
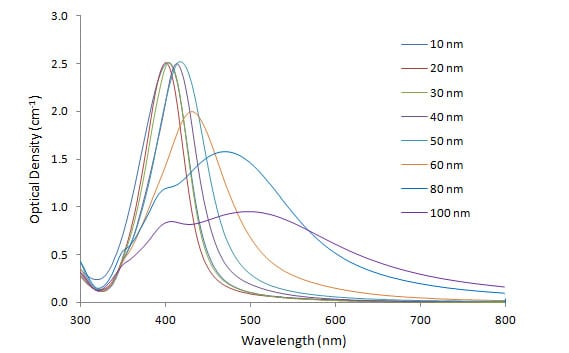
Figure 1 shows the plasmon resonance spectra of different sizes of Cytodiagnostics silver nanoparticles, as measured with UV-visible spectroscopy. As the particle size increases from 10 to 100 nm, the absorbance peak (lambda max) increases from 400 nm to 500 nm, and broadens in width. For particles of greater size, especially above 80 nm, a secondary peak at lower wavelength becomes apparent, which is a result of quadrupole resonance, in addition to the primary dipole resonance.

Figure 1. Silver nanoparticle size dependant surface plasmon resonance. Note the red-shift of the absorption maximum as the gold nanoparticle size increases.
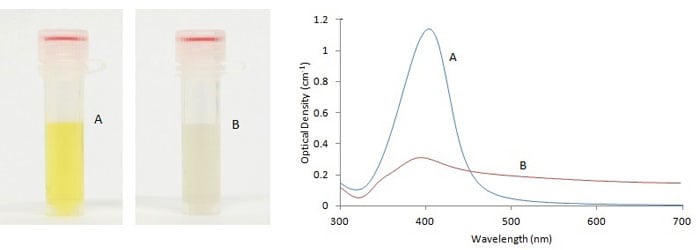
The aggregation state of silver nanoparticles also has significant effect on their optical properties. This fact can be used to monitor the stability of silver nanoparticles, both over time, and upon addition of salt-containing buffers, which at high enough concentrations cause particle aggregation. As shown in the absorbance spectra in Figure 2, aggregation is indicated by a decrease in the primary peak, and an increase in the red region.

Figure 2. Visual appearance and UV-VIS spectra of monodisperse (A) and sodium chloride (NaCl) induced agglomeration (B) of 10nm silver nanoparticles.
Comparison of Silver Nanoparticles vs. Gold Nanoparticles
Both silver nanoparticles and gold nanoparticles are commonly employed in optical detection for their surface plasmon resonance effect. The plasmon excitation efficiency of silver nanoparticles is known to be even more pronounced than that of gold nanoparticles, as shown in their stronger, sharper plasmon resonance peaks at the same particle concentration. Silver nanoparticles thus can render better sensitivity for some applications, such as localized surface plasmon resonance or surface enhanced Raman scattering detection.
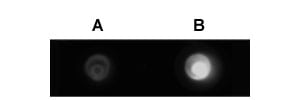
Silver nanoparticles may also be advantageous over gold nanoparticles, when used in combination with fluorescence emission detection. Most fluorophores emits at a wavelength above 500 nm. However, the plasmon resonance absorbance of gold nanoparticles is primarily in the range of 500-600 nm, and hence can quench the detectable fluorescence to some extent, when the fluorescent dyes are close to the particle surface. This issue of fluorescence quenching is minimized for silver nanoparticles, as their plasmon resonance absorbance is mostly below 500 nm, with little overlapping with the emission wavelength of most fluorescent dyes. Figure 3 shows images of fluorescent gold and silver nanoparticles, labeled with the same amount of Cyto633 fluorescent dye. The fluorescent signal from silver is about 4 times stronger than that of gold.

Figure 3. Gold (A) and silver nanoparticles (B) surface-modified with the same amount of Cyto633 fluorescent dye.
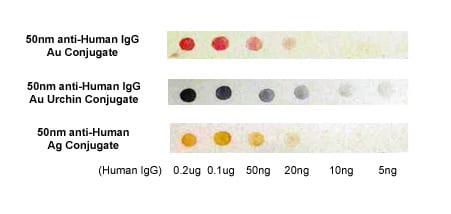
With their different wavelengths of plasmon resonance, silver and gold nanoparticles, or particles of different size or shapes, can also be used together for multiplexed detection, taking advantage of the extended range of detection spectrum. Figure 4 shows dark field microscope images of Cytodiagnostics silver nanoparticles, gold nanoparticles and gold nano-urchins.


Figure 4. This image highlights the difference in appearance between silver nanoparticles, gold nanoparticles and gold nanourchins in darkfield microscopy (top) and in a immuno-dot blot assay (bottom).
Table I. Summary of optical and physical properties of Cytodiagnostics silver nanoparticles of various sizes.
| Diameter (nm) |
Peak SPR Wavelength (nm) | NPS/ml | Wt. Conc (mg/ml) | Size Dispersity (+/-nm) | Particle Volume (nm3) |
Surface Area (nm2) | Surface/ Volume Ratio |
Particle Mass (g) | Molar Mass (g/mol) | Molar Concentration |
| 10 | 390-405 | ~3.6E+12 | 2.0E-02 | <18% | 5.24E+02 | 3.14E+02 | 0.600 | 5.49E-18 | 3.31E+06 | 5.98E-09 |
| 20 | 390-410 | ~4.6E+11 | 2.0E-02 | <15% | 4.19E+03 | 1.26E+03 | 0.300 | 4.39E-17 | 2.65E+07 | 7.64E-10 |
| 30 | 400-410 | ~1.4E+11 | 2.0E-02 | <15% | 1.41E+04 | 2.83E+03 | 0.200 | 1.48E-16 | 8.93E+07 | 2.32E-10 |
| 40 | 405-425 | ~5.7E+10 | 2.0E-02 | <15% | 3.35E+04 | 5.03E+03 | 0.150 | 3.52E-16 | 2.12E+08 | 9.47E-11 |
| 50 | 410-430 | ~2.9E+10 | 2.0E-02 | <12% | 6.54E+04 | 7.85E+03 | 0.120 | 6.87E-16 | 4.13E+08 | 4.28E-11 |
| 60 | 425-450 | ~1.7E+10 | 2.0E-02 | <12% | 1.13E+05 | 1.13E+04 | 0.100 | 1.19E-15 | 7.14E+08 | 2.82E-11 |
| 80 | 440-480 | ~7.1E+09 | 2.0E-02 | <12% | 2.68E+05 | 2.01E+04 | 0.075 | 2.81E-15 | 1.69E+09 | 1.18E-11 |
| 100 | 480-520 | ~3.6E+09 | 2.0E-02 | <10% | 5.24E+05 | 3.14E+04 | 0.060 | 5.49E-15 | 3.31E+09 | 5.98E-12 |