Benchmarking BRB-seq, QuantSeq-Pool and NEBNex Ultra II

Since the initial BRB-seq publication (Alpern et al., 2019), we have continually optimized the BRB-seq workflow to lower the detection limit, reduce cross-contamination between samples, and expand the range of tissues and organisms where BRB-seq can be used. In particular, our novel globin depletion kit now allows efficient sequencing of blood samples.

Given these improvements, in this article we compare our optimized BRB-seq protocol to two widely used state-of-the-art library preparation technologies; the QuantSeq-Pool (LEX) and NEBNex Ultra II (NEB).

Original BRB-seq comparison:

In our original BRB-seq publication, we compared BRB-seq to the ‘gold standard’ Illumina TruSeq Stranded mRNA library preparation method for bulk transcriptomics (Alpern et al., 2019).

At the same sequencing depth, both approaches found similar numbers of expressed genes (Fig. 1A), differentially expressed (DE) genes (Fig. 1B), and a similar correlation between replicates (Fig. 1C).

Figure 1. Comparison of BRB-seq and TruSeq, downsampled at 1M reads. (A) Comparison of the number of detected expressed genes and (B) the number of differentially expressed genes. True positives are called from a gold standard TruSeq at 30M depth. (C) Correlation between BRB-seq replicates (left) and BRB-seq vs TruSeq samples (right).

Comparison of optimized BRB-seq to LEX and NEB:

Novel methods are now using 3’ mRNA-seq stranded multiplexed technologies such as BRB-seq and the LEX method from Lexogen.

We compared these to the NEB method from New England Biolabs to show that multiplexed methods such as BRB-seq and LEX now give data of a similar quality to standard non-multiplexed methods.

We sequenced three biological replicates in two conditions: non-differentiated adipose stromal population cells (ND) and differentiated adipocytes (D) (Fig. 2). This was done with each technology and allowed us to compare the three protocols, and their potential to aid biological interpretation of experiments.

Thanks to this experimental design, we could compare both the sensitivity of the protocols, and the amount of DE genes found between the two conditions. This DE analysis is one of the most prevalent type of analyses in transcriptomics.

Figure 2. Samples used for benchmarking BRB-seq, QuantSeq and NEBNex Ultra II. We used three replicates of ASPCs (Adipose Stromal Population Cells) that we differentiated into mature adipocytes so we could compare the differentiated genes between the two transcriptional states.

Key findings:

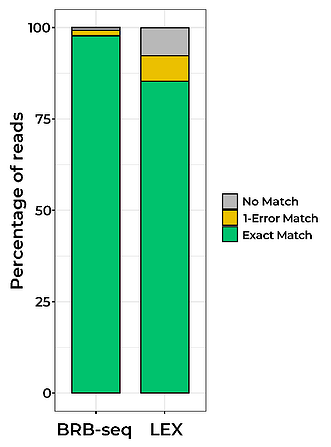
Firstly, we compared the multiplexing efficiency of BRB-seq and LEX. We found that demultiplexing was more efficient for BRB-seq (99%) compared to LEX (92%) (Fig. 3).

Figure 3. Demultiplexing results between the two multiplexed strategies (BRB-seq & LEX). This is the total number of reads that we were able to demultiplex (green + yellow) across all samples.

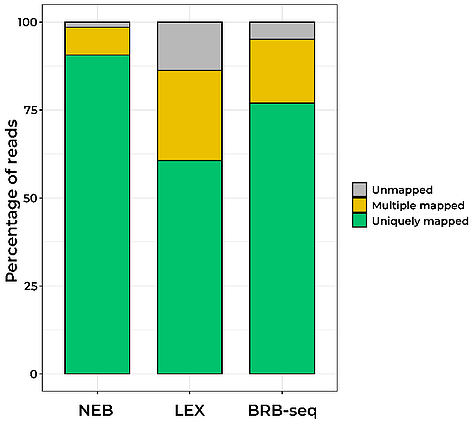
Next, we compared the quality of the sequenced reads across all three protocols by assessing the percentage of reads mapping to the mus musculus reference genome (Fig. 4).

BRB-seq results were more similar to NEB than to LEX (Fig. 4). Both BRB-seq and LEX had lower mapping rates than NEB with 92% uniquely mapped reads. However, BRB-seq still had a relatively high 77% uniquely mapped reads. LEX had far fewer with only 61% uniquely mapped reads.

Figure 4. Results of alignment to the mus musculus mm10 reference genome. Stacked bar plots showing the percentage of reads mapped to the mus musculus genome for each protocol. Certain pipelines filter out the multiple mapped reads, i.e., reads that map to multiple different regions of the genome. In this case, only the uniquely mapped reads were used for the next step of counting gene features.

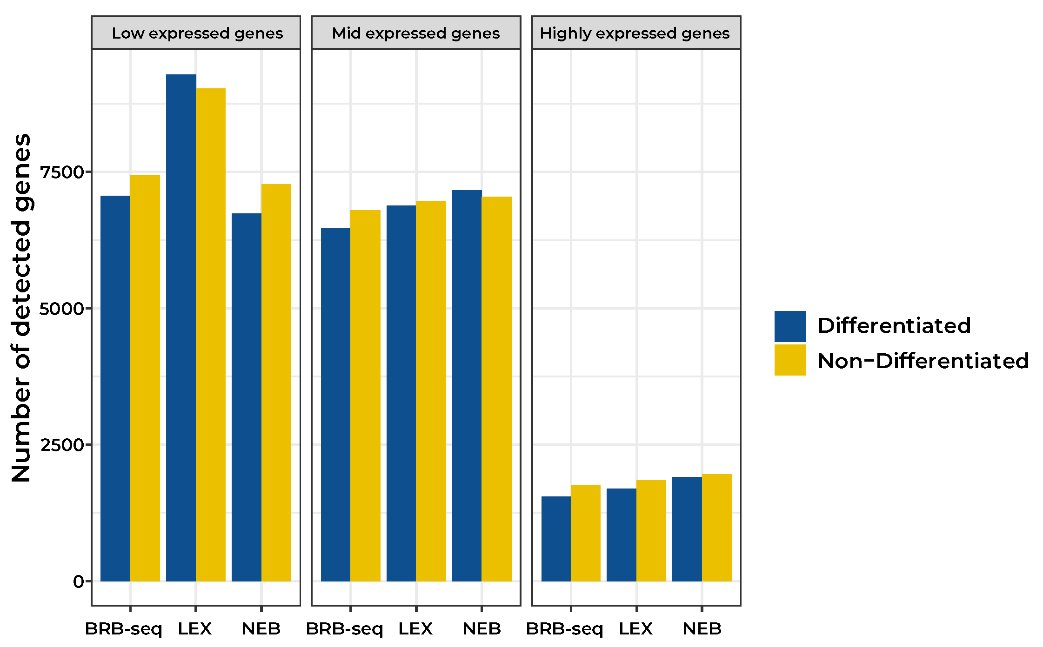
Furthermore, LEX detected a higher number of low expressed genes. In contrast, both NEB and BRB-seq detected fewer low expressed genes than LEX (Fig. 5). All three methods detected a similar number of mid- and highly-expressed genes at the same sequencing depth (Fig. 5).

The NEB protocol should be much more sensitive than LEX to detect these lowly expressed genes. Taken together, with the lower percentage of mapped reads from the LEX method, this possibly points towards incorrectly mapped reads when using this protocol.

Figure 5. Number of detected genes per protocol. Bar plots showing the number of detected genes for each of the three protocols. We separated the non-differentiated and differentiated conditions, to show that there is no major effect on the detection of expressed genes depending on condition. We also separated the genes into three categories: low expressed (left, 0 < counts per million (cpm) < 10), mid expressed (middle, 10 < cpm < 100), and highly expressed (right, cpm > 100)


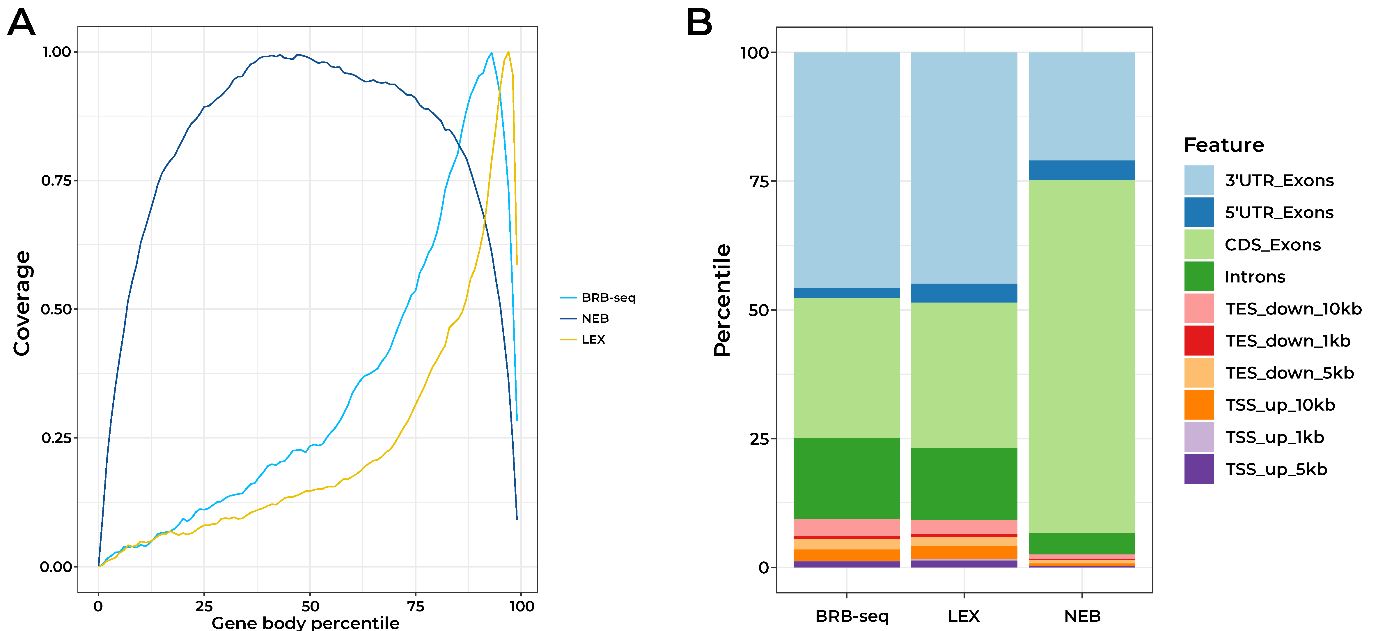
On the other hand, we found a higher percentage of reads mapped to the 3’ untranslated region (UTR) for BRB-seq and LEX compared to NEB when we analyzed the distribution of reads over gene features for each technique (Fig. 6). This is expected given the fact that BRB-seq and LEX are both 3’-based protocols, whereas NEB is a full-length mRNA-seq protocol.

Figure 6. Read coverage on genes and other genomic loci. (A) Plot showing the read coverage along the gene body, from 0% (TSS, 5’) to 100% (TES, 3’), normalized across all genes. It shows that reads from the NEB full-length mRNA method cover mRNA transcripts from 5’ to 3’, while reads from BRB-seq and LEX mainly cover the 3’ end of mRNA as expected. (B) Stacked bar plot showing the read distribution across the different regions of the exome (TES, TSS, 3’UTR, 5’UTR, Exons an Introns).

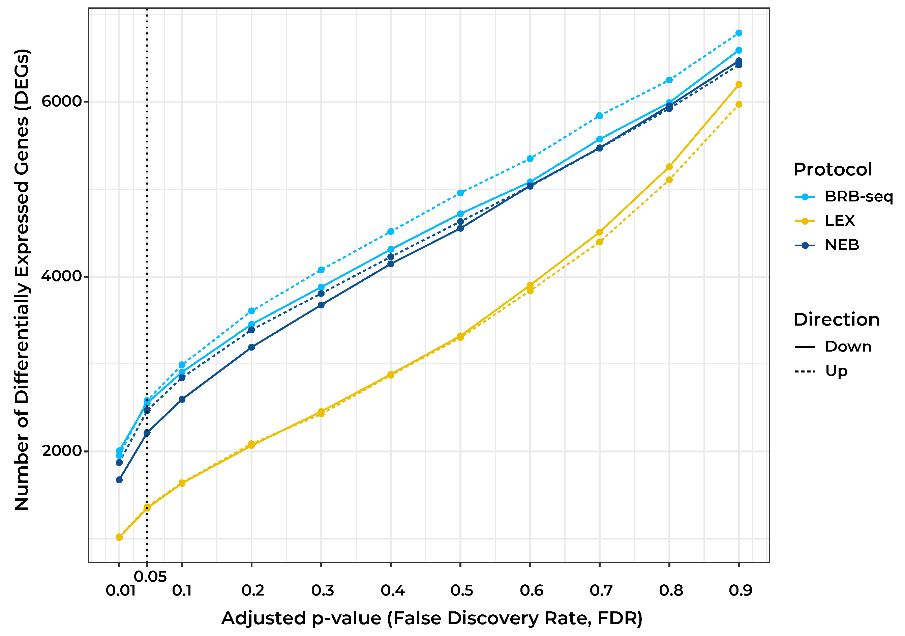
Finally, when we compared gene expression across the two biological conditions, LEX detected far less DE genes than the two other methods (Fig. 7). BRB-seq and NEB detected almost twice the number of DE genes compared to LEX at a false discovery rate threshold of 5% (FDR5%), (Fig. 7). In contrast, BRB-seq and NEB detected very similar numbers of DE genes.

Figure 7. Number of differentially expressed genes detected. This figure shows the number of DE genes between the two conditions (ND vs D) found by each protocol. The x-axis shows the results using different FDR cutoffs. The FDR5% cutoff is indicated by a vertical dotted line.

Summary:

In conclusion, BRB-seq libraries performed significantly better than LEX, in almost all metrics we evaluated: demultiplexing rate (99% vs 92%), mapping rate (77% vs 61%), and number of detected DE genes (two-fold more). The only exception was the number of detected lowly expressed genes, which was much higher than expected for LEX compared to NEB. As NEB is the most sensitive technique used, this suggests issues with spurious read mapping along the exome.

BRB-seq achieved similar results to NEB, in almost all performance metrics. The only main difference came from the alignment rate, which was lower for BRB-seq (77%) than NEB (92%). This is a characteristic of 3’-based protocols, but the effect is limited in BRB-seq compared to other methods. Aligned reads from BRB-seq detected a similar number of genes as the NEB protocol so likely have the same quality.

Importantly, both techniques detect similar numbers of DE genes. This suggests BRB-seq would be an ideal option for most transcriptomic studies in the future.

To find out more about how BRB-seq could help your study, please contact us at info@stratech.co.uk

References:

Alpern, D., Gardeux, V., Russeil, J., Mangeat, B., Meireles-Filho, A.C., Breysse, R., Hacker, D. and Deplancke, B., 2019. BRB-seq: ultra-affordable high-throughput transcriptomics enabled by bulk RNA barcoding and sequencing. Genome biology, 20(1), pp.1-15.

SUPPORT

outstanding technical support

PRODUCT

we offer a full product guarantee

DELIVERY

we offer free delivery to UK universities and non profit organisations