Gold Nanoparticle Properties
Background
Gold nanoparticles (colloidial gold) have been extensively used for applications both in biology (e.g. bio-imaging) and technology (e.g. photonics) due their unique optical properties. These properties are conferred by the interaction of light with electrons on the gold nanoparticle surface. At a specific wavelength (frequency) of light, collective oscillation of electrons on the gold nanoparticle surface cause a phenomenon called surface plasmon resonance (figure 1) resulting in strong extinction of light (absorption and scattering). The particular wavelength, or frequency, of light where this occurs is strongly dependant on the gold nanoparticle size, shape, surface and agglomeration state as described in more detail below.
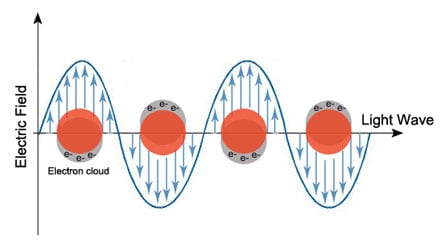
Figure 1. Basics of localized surface plasmon resonance (LSPR) of gold nanoparticles due to collective oscillation of surface electrons with incident light at a specific wavelength.
Gold Nanoparticle Size
The influence of gold nanoparticle size on the surface plasmon resonance is illustrated in figure 2 below where the absorption maximum (lambda max) increases from 520nm to 570nm for Cytodiagnostics 20nm and 100nm spherical gold nanoparticles, respectively. Particles with sizes above 100nm have broader peaks spanning into the 600nm range due to the presence of both transversal and longitudinal surface plasmon resonances. In comparison, gold nanoparticles with diameters below 2nm do not exhibit surface plasmon resonance.
The difference in extinction between different sized gold nanoparticles can conveniently be utilized for multiplexing.
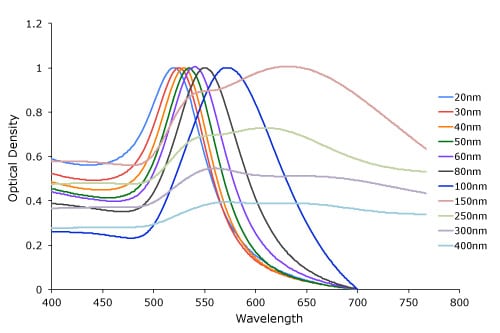
Figure 2. Gold nanoparticle size dependant surface plasmon resonance. Note the red-shift of the absorption maximum as the gold nanoparticle size increases.
Gold Nanoparticle Shape
A major determinant of the optical properties of gold nanoparticles is their shape. By synthesizing gold nanoparticles of different shapes, the surface plasmon resonance can easily be tuned to give absorption maxima from around 500nm into the near-infrared part of the spectrum. As an example, Cytodiagnostics spherical collodial gold have absorbance maxima between 515-570nm as described above, while irregular shaped particles such as gold nanorods, and urchin shaped gold nanoparticles (also called gold nanostars) have absorption maximum in the near-infrared region of the spectra, figure 3. For custom synthesis of gold nanoparticles with irregular shapes please contact info@stratech.co.uk.
The difference in absorption properties between spherical and irregular-shaped gold nanoparticles of the same average size is caused by an anisotropic (uneven) distribution of the surface electron layers.
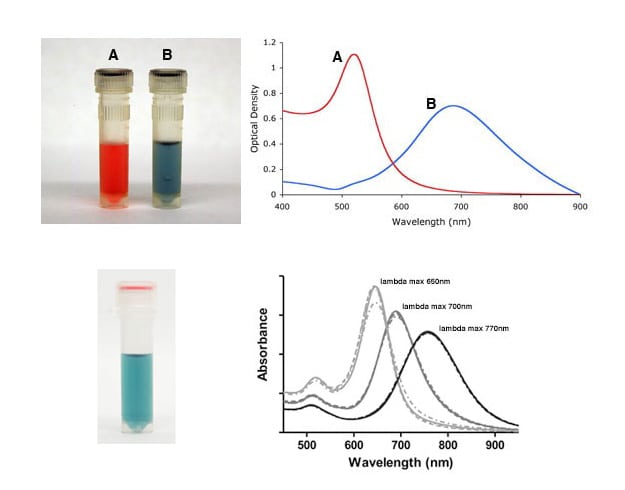
Figure 3. (Top) Gold nanoparticle shape dependant localized surface plasmon resonance as indicated by the visual appearance and UV-VIS spectra of spherical (A), and urchin-shaped (B) gold nanoparticles (gold nanostars). (Bottom) Absorbance spectra for gold nanorods with three different aspect ratios. Note the presence of two absorption peaks, which are caused by both transversal and longitudinal surface plasmon resonances.
Urchin shaped (spiky) gold nanoparticles (gold nanostars) are preferable over spherical particles in in vivo based applications due to a reduced background, and higher penetration of near-infrared light through biological tissues. Also, irregular-shaped gold nanoparticles give higher signal in Surface-Enhanced Raman Spectroscopy (SERS) due to enhancement of the electromagnetic field on the surface caused by the irregular shaped particles. In comparison, spherical particles are ideal for use in application such as immunogold dot-blot protocols (see figure 4 below) and lateral flow rapid tests.
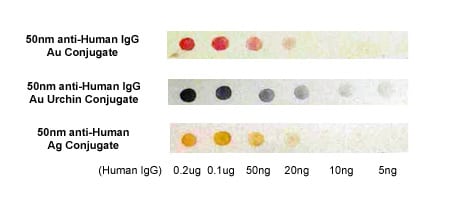
Figure 4. Immuno-dot blot assay illustrating the difference in appearance (color) for three different types of noble metal protein conjugates varying in shape and composition.
Gold Nanoparticle Aggregation
As mentioned above, the aggregation state of gold nanoparticles have an effect on their optical properties. This fact can be used to monitor gold nanoparticle stability, both over time, and upon addition of salt-containing buffers, which at high enough concentrations cause particle aggregation, figure 5. The red-shift in absorption maximum caused by aggregation, or particles in close proximity, have successfully been utilized in many assays as a detection mechanism.
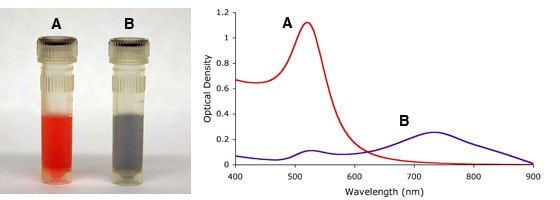
Figure 5. Visual appearance and UV-VIS spectra of monodisperse (A) and sodium chloride (NaCl) induced agglomeration (B) of 15nm gold nanoparticles.
Table I. Summary of the optical and physical properties of Cytodiagnostics gold nanoparticles of various sizes.
| Diameter (nm) |
Peak SPR Wavelength (nm) | NPS/ml | Wt. Conc (mg/ml) | Molar Ext (M-1cm-1) | Size Dispersity (+/-nm) | Particle Volume (nm3) |
Surface Area (nm2) | Surface/ Volume Ratio |
Particle Mass (g) | Molar Mass (g/mol) | Molar Concentration |
| 5 | 515-520 | 5.47E+13 | 6.94E-02 | 1.10E+07 | <15% | 6.54E+01 | 7.85E+01 | 1.200 | 1.27E-18 | 7.64E+05 | 9.08E-08 |
| 10 | 515-520 | 5.98E+12 | 6.07E-02 | 1.01E+08 | <15% | 5.24E+02 | 3.14E+02 | 0.600 | 1.02E-17 | 6.11E+06 | 9.93E-09 |
| 15 | 520 | 1.64E+12 | 5.61E-02 | 3.67E+08 | <12% | 1.77E+03 | 7.07E+02 | 0.400 | 3.43E-17 | 2.06E+07 | 2.72E-09 |
| 20 | 524 | 6.54E+11 | 5.31E-02 | 9.21E+08 | <12% | 4.19E+03 | 1.26E+03 | 0.300 | 8.12E-17 | 4.89E+07 | 1.09E-09 |
| 30 | 526 | 1.79E+11 | 4.91E-02 | 3.36E+09 | <12% | 1.41E+04 | 2.83E+03 | 0.200 | 2.74E-16 | 1.65E+08 | 2.98E-10 |
| 40 | 530 | 7.15E+10 | 4.65E-02 | 8.42E+09 | <12% | 3.35E+04 | 5.03E+03 | 0.150 | 6.50E-16 | 3.91E+08 | 1.19E-10 |
| 50 | 535 | 3.51E+10 | 4.45E-02 | 1.72E+10 | <10% | 6.54E+04 | 7.85E+03 | 0.120 | 1.27E-15 | 7.64E+08 | 5.83E-11 |
| 60 | 540 | 1.96E+10 | 4.30E-02 | 3.07E+10 | <10% | 1.13E+05 | 1.13E+04 | 0.100 | 2.19E-15 | 1.32E+09 | 3.25E-11 |
| 70 | 548 | 1.20E+10 | 4.17E-02 | 5.03E+10 | <10% | 1.80E+05 | 1.54E+04 | 0.086 | 3.48E-15 | 2.10E+09 | 1.99E-11 |
| 80 | 553 | 7.82E+09 | 4.06E-02 | 7.70E+10 | <10% | 2.68E+05 | 2.01E+04 | 0.075 | 5.20E-15 | 3.13E+09 | 1.30E-11 |
| 90 | 564 | 5.37E+09 | 3.97E-02 | 1.12E+11 | <8% | 3.82E+05 | 2.54E+04 | 0.067 | 7.40E-15 | 4.46E+09 | 8.92E-12 |
| 100 | 572 | 3.84E+09 | 3.89E-02 | 1.57E+11 | <8% | 5.24E+05 | 3.14E+04 | 0.060 | 1.02E-14 | 6.11E+09 | 6.37E-12 |
| Diameter (nm) |
NPS/ml | Wt. Conc (mg/ml) | Size Dispersity (+/-nm) | Particle Volume (nm3) |
Surface Area (nm2) | Surface/ Volume Ratio | Particle Mass (g) |
Molar Mass (g/mol) | Molar Concentration |
| 150 | 3.60E+09 | 1.20E-01 | <8% | 1.77E+06 | 7.07E+04 | 0.040 | 3.43E-14 | 2.06E+10 | 5.98E-12 |
| 200 | 1.91E+09 | 1.55E-01 | <8% | 4.19E+06 | 1.26E+05 | 0.030 | 8.12E-14 | 4.89E+10 | 3.17E-12 |
| 250 | 7.08E+08 | 1.13E-01 | <8% | 8.18E+06 | 1.96E+05 | 0.024 | 1.59E-13 | 9.55E+10 | 1.18E-12 |
| 300 | 4.50E+08 | 1.24E-01 | <8% | 1.41E+07 | 2.83E+05 | 0.020 | 2.74E-13 | 1.65E+11 | 7.48E-13 |
| 400 | 1.88E+08 | 1.22E-01 | <8% | 3.35E+07 | 5.03E+05 | 0.015 | 6.50E-13 | 3.91E+11 | 3.12E-13 |